


Chaque ingénieur de service public a déjà ressenti cette sensation : le rapport de diagnostic d'un laboratoire DGA arrive pour un transformateur de 30 MVA et révèle que la teneur en hydrogène a augmenté au cours de trois rapports d'échantillons, mais il n'y a pas le temps d'examiner la raison car le rapport est placé dans un tiroir et le plan opérationnel a été préparé il y a longtemps. Six mois plus tard, le transformateur tombe en panne à 3 heures du matin et la société de services publics se retrouve avec $800,000 à payer pour les coûts de remplacement, la logistique et les matières premières perdues. La solution est déjà disponible. Il s'agit d'un système de gestion du cycle de vie des transformateurs basé sur les big data qui collecte tous les points de données imaginables (tests de production, chocs de transport, mise en service, tendances DGA, température, charge, fonctionnement du changeur de prises et dossiers de maintenance) et fournit des analyses sur les informations vous indiquant la date de la panne et son coût.
Dans cet article, l'auteur énonce les principes de la structure d'un système de gestion du cycle de vie basé sur les données, les techniques (surveillance de l'état, jumeaux numériques, maintenance centrée sur la fiabilité, analyses prédictives) et l'économie de la mise en œuvre. Si vous gérez au moins dix transformateurs, le besoin d'une mise en œuvre pratique d'un modèle structuré de gestion du cycle de vie est évident.
Réponse courte : Le modèle complet de gestion du cycle de vie des transformateurs basé sur les big data fait référence à un système de données pour l'enregistrement et le traitement de chaque événement possible qui se produit dans la vie d'un transformateur – résultats de tests de production, données sur l'expédition, tests de mise en service, surveillance en ligne (DGA, température, humidité, charge), historique de maintenance, incidents de pannes – dans le but d'améliorer le processus de maintenance, de prédire les périodes de pannes et de remplacement.
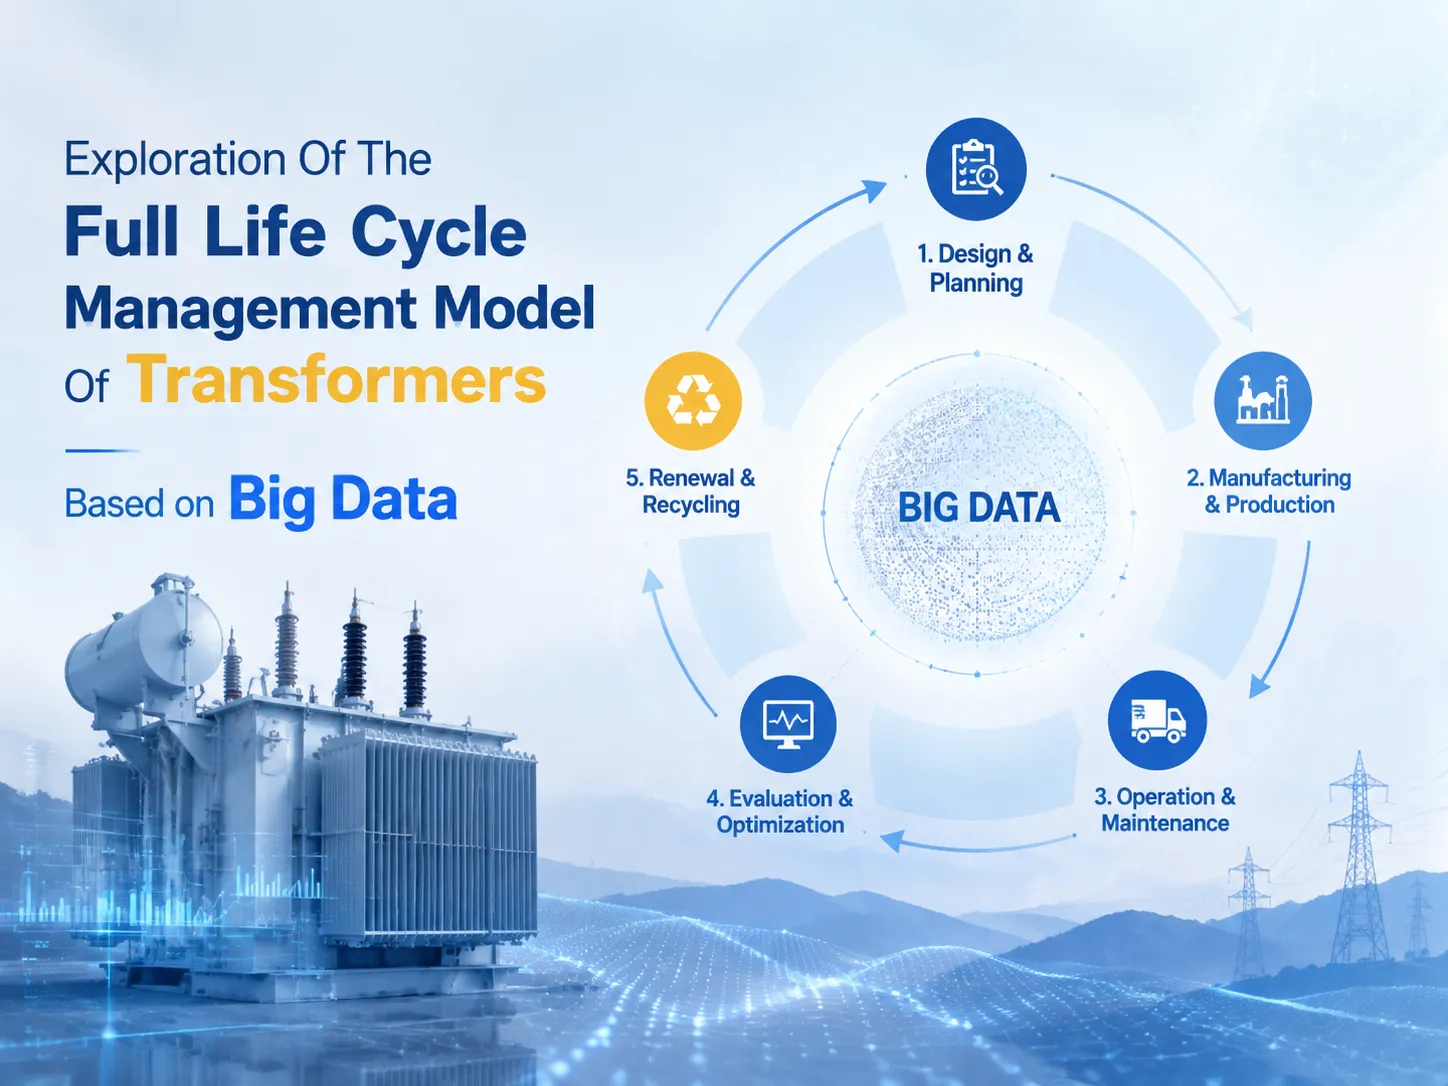
Table des matières
- Qu'est-ce que la gestion complète du cycle de vie pour les transformateurs ?
- Les étapes du cycle de vie et les données collectées (Tableau)
- L'architecture Big Data : Des capteurs aux décisions
- Techniques principales : Surveillance, Jumeau numérique et Analyses prédictives
- Gestion traditionnelle vs. Gestion basée sur les données (Tableau comparatif)
- L'économie : Coûts, Économies et Retour sur investissement (Tableau)
- Feuille de route de mise en œuvre pour les propriétaires d'actifs
- Le rôle du fabricant : Données qui commencent à l'usine
- Questions Fréquemment Posées
- Références
- Conclusion
Qu'est-ce que la gestion complète du cycle de vie pour les transformateurs ?
La gestion du cycle de vie complet (LCM) des transformateurs considère le transformateur comme un actif qui suit un cycle de vie financier et technique, qui devrait être exploité dans la prise de décision tout au long de ce cycle de vie en utilisant des données. La gestion traditionnelle fonctionne en silos : l'usine produit un rapport sur les tests, l'installateur note la mise en service, le département de maintenance effectue des tests chaque année, et le département de planification décide du remplacement—lorsque l'information est limitée et que la boucle de rétroaction n'a pas été établie. Le modèle basé sur le big data résout le problème en fournissant un enregistrement continu marqué par des horodatages pour chaque unité et en utilisant l'historique pour créer des réponses aux questions futures—quand tester ce transformateur ? Est-ce un défaut en développement lié à la tendance croissante des gaz ? Doit-il être rénové ou remplacé et quand est le moment le moins coûteux pour cela ?
La source intellectuelle des idées est la méthodologie de maintenance centrée sur la fiabilité (RCM), et les normes de gestion des actifs qui la soutiennent, comme la norme IEC 60076-17 et la série IEC 60300 sur la fiabilité. Le big data permet de mettre en œuvre ces idées à une échelle sans précédent—des milliers d'unités, des données continues et des modèles qui s'améliorent chaque seconde.
Les étapes du cycle de vie & données collectées
| Étape du cycle de vie | Données collectées | Décisions de gestion rendues possibles |
|---|---|---|
| Conception & fabrication | Propriétés des matériaux, dossiers de séchage, tests en usine, numérique tel que construit | Base de référence pour toutes les comparaisons futures ; vérification de la garantie de perte |
| Transport et installation | Dossiers de choc/inclinaison, documentation de manutention, conditions du site | Détecter les dommages de transport avant l'énergisation |
| Mise en service | Batterie de tests complète, base de référence DGA, réglages du changeur de prises | Confirmer un démarrage sain ; établir des bases de référence de tendance |
| Fonctionnement | Charge, température, tension, harmoniques, alarmes | Optimisation de la charge ; évaluation du risque de surcharge |
| Entretien | Résultats des tests, échantillons d'huile, réparations, utilisation de pièces de rechange | Planification basée sur l'état ; suivi des coûts |
| Panne & réparation | Dossiers de défauts, signatures de gaz, détails de réparation | Analyse des causes profondes ; retour d'information sur la conception et le processus |
| Fin de vie | Âge, état, modèles de vie résiduelle, données d'élimination | Moment du remplacement ou de la rénovation |
Prenez note des différences dans ce modèle et de la manière dont il varie par rapport à un bon manuel de maintenance. Dans ce cas, l'information est transmise dans les deux sens — en avant et en arrière. Lorsqu'un choc de transport est enregistré lors de l'installation de l'équipement, cela changera la base de référence. Une lecture d'humidité en usine est essentielle pour comprendre comment la tendance de résistance à l'isolation se développera dans les années à venir. Un modèle de pannes de changeurs de prises à l'échelle de la flotte déterminera les spécifications pour le prochain lot d'achats.
L'architecture Big Data : Des capteurs aux décisions
Il existe cinq couches dans un système fonctionnel de big data. La couche de détection capture des données qui incluent des dispositifs de mesure DGA en ligne, des capteurs de température, des détecteurs d'humidité, des compteurs de charge et des compteurs de changeur de prises. La couche de communication transmet ensuite les données généralement via Modbus RTU/TCP, IEC 61850 dans les sous-stations contemporaines, et par la technologie cellulaire pour les dispositifs distants. À son tour, la couche d'analyse met en œuvre des modèles d'analyse de tendance et d'analyse de ratio de gaz selon IEC 60599, des modèles de consommation de vie thermique basés sur les guides de charge IEEE, et une corrélation statistique avec la flotte dans son ensemble. En fin de compte, la couche de décision systématise les informations et les ordres de production alloués dans le système de gestion des actifs.
L'architecture ne parvient pas à livrer des résultats en raison de raisons prévisibles, que les professionnels évitent. Tout d'abord, la qualité des données est une préoccupation, puisque le capteur qui n'a pas été calibré génère des données précises mais inutiles. Deuxièmement, l'intégration doit être orientée vers les affaires, et non vers l'informatique, car la plateforme est inutile pour les spécialistes. Troisièmement, une décision spéciale doit être mise en place d'abord avant de commencer la collecte de données, ce qui signifie que “quel dispositif doit être vérifié au cours d'un trimestre particulier” doit être défini d'abord avant d'investir de l'argent dans des capteurs.
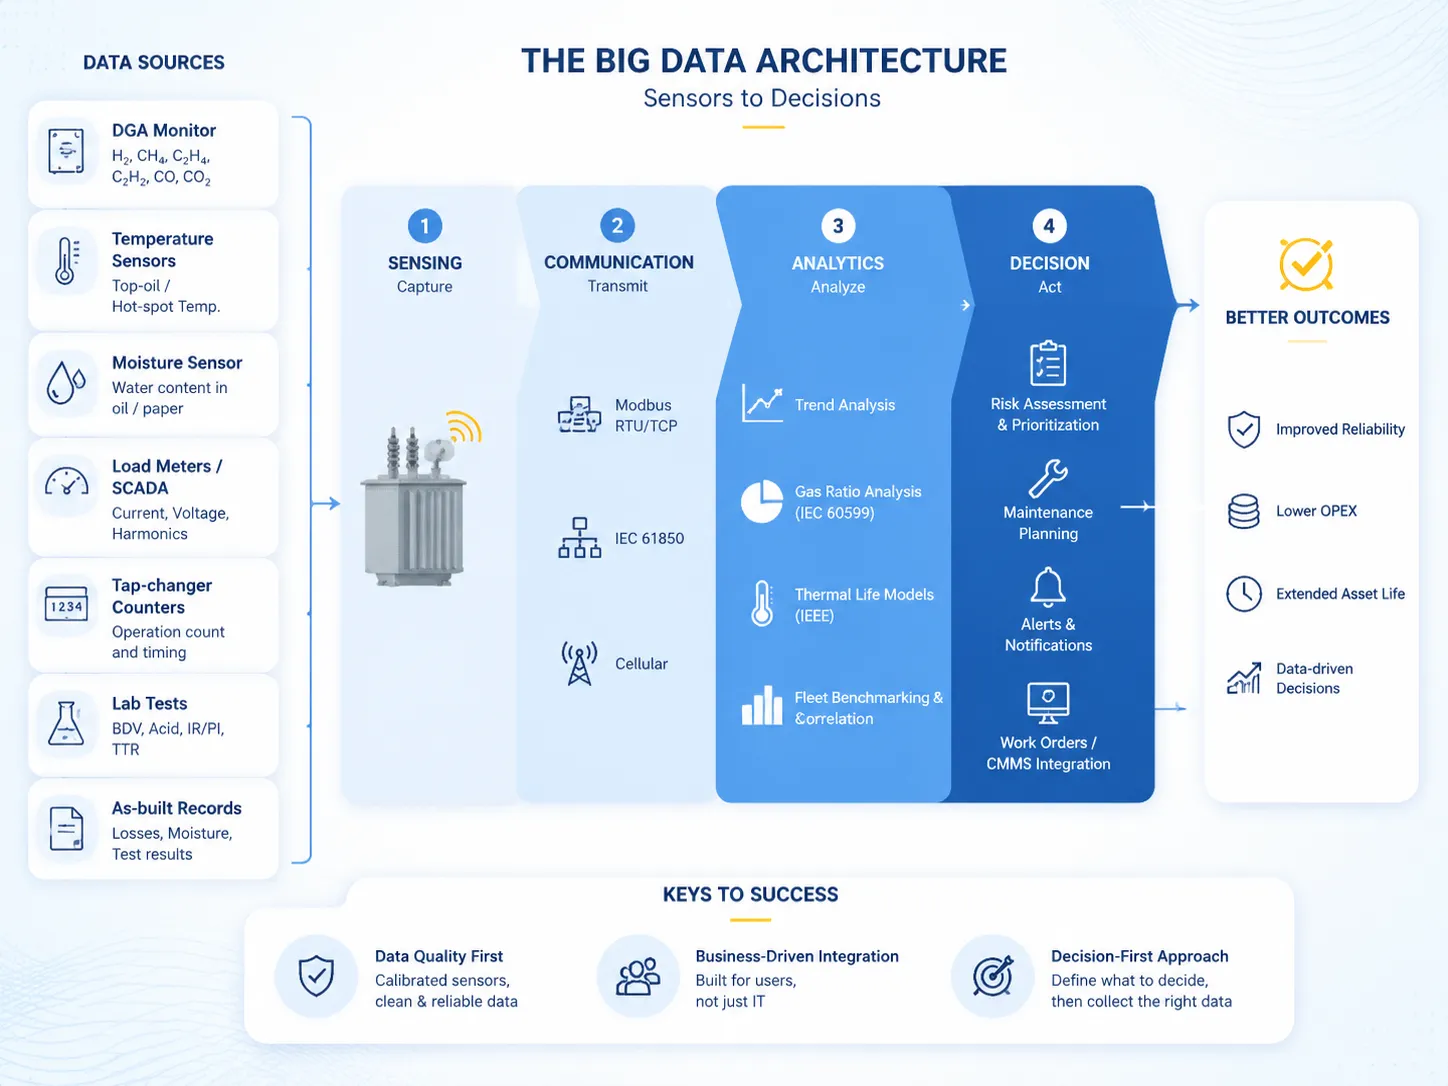
| Source de données | Données capturées | Utilisation principale de l'analyse |
|---|---|---|
| Moniteur DGA en ligne | H₂, CH₄, C₂H₄, C₂H₂, CO, CO₂ | Identification du type de défaut, alarmes de tendance |
| Capteurs de température des enroulements / huile supérieure | Température des points chauds et de l'huile | Vieillissement thermique, décisions de surcharge |
| Capteur d'humidité | Teneur en eau dans l'huile/papier | État de l'isolation, déclencheurs de séchage |
| Compteurs de charge / SCADA | Courant, tension, harmoniques | Optimisation de la charge, calcul des pertes |
| Compteurs de changeur de prises | Compte des opérations et chronométrage | Usure de l'OLTC, planification de la maintenance |
| Tests de laboratoire sur l'huile/l'électrique | BDV, acide, IR/PI, TTR | Évaluation annuelle de l'état |
| Dossiers de construction d'usine | Pertes, humidité, résultats des tests | Ligne de base de déviation, analyse des pannes |
Techniques principales : Surveillance, Jumeau numérique et Analyses prédictives
Trois méthodes principales constituant la majorité de la valeur. La surveillance de l'état en ligne est la fondation : la combinaison de DGA continue, de température, d'humidité et de données de charge donne un avertissement précoce qui ne peut être obtenu par un échantillonnage annuel. Cela est devenu la norme pour les unités critiques — le DGA en ligne permet de surveiller des transformateurs d'une capacité de plus de 10 MVA pour $15,000–45,000. Les jumeaux numériques vont un peu plus loin : la technologie permet la comparaison des données surveillées en temps réel avec le modèle tel que construit. En conséquence, toute déviation par rapport à la ligne de base thermique ou de gaz calculée indiquera un problème émergent beaucoup plus tôt que dans le cas des limites fixées. L'analyse prédictive fournit le lien entre ces deux outils.
Une chose de plus à mentionner est que les outils les plus efficaces dans ce domaine particulier intègrent des modèles basés sur la physique avec des données mais pas uniquement des données. La méthodologie de consommation de vie IEEE C57.140 et les directives IEC 60076-17 fournissent la physique, tandis que les données de flotte fournissent les probabilités antérieures. Les consommateurs de la plateforme d'analyse doivent clarifier comment ces outils fonctionnent avec de petites quantités de données, car il existe des situations où il n'y a pas suffisamment de données pour développer un modèle régulièrement. Une entreprise avec trente transformateurs, par exemple, ne peut pas créer son modèle d'apprentissage profond en raison de la disponibilité d'une petite quantité de données. Cependant, elle peut utiliser le modèle de scoring de risque bayésien basé sur des antécédents industriels.
| Technique de surveillance | Ce qu'elle détecte | Coût matériel | Meilleure adéquation |
|---|---|---|---|
| DGA de laboratoire annuelle | Tendances des gaz lents | $80–$250 par échantillon | Unités de faible criticité |
| Moniteur DGA en ligne | Évolution rapide des gaz | $15,000–$45,000 | Unités critiques de réseau / industrielles |
| Température de l'enroulement en fibre optique | Lecture directe des points chauds | $20,000–$60,000 | Grands transformateurs de puissance |
| Sonde d'humidité en ligne | Tendances d'humidité papier/huiles | $3,000–$10,000 | Climats humides, unités vieillies |
| SFRA (périodique) | Déformation de l'enroulement | $20,000–$60,000 (ensemble de tests) | Après des courts-circuits, transport |
| Moniteur de décharge partielle | Défauts d'isolation | $25,000–$80,000 | Unités HV, transformateurs de convertisseur |
Gestion traditionnelle vs. gestion basée sur les données
| Dimension | Gestion traditionnelle | Modèle de cycle de vie des Big Data |
|---|---|---|
| Fréquence des données | Tests de laboratoire annuels | Continu / quasi temps réel |
| Déclencheur de maintenance | Temps calendaire | État et risque |
| Détection de pannes | Après l'alarme | Avant l'alarme (prédiction de tendance) |
| Base de décision | Dernier résultat de test | Historique complet de la vie + statistiques de flotte |
| Moment de remplacement | Règle basée sur l'âge | Modèle de coût et de durée de vie résiduelle |
| Impact du taux de pannes | Référence | Réduction de 30–50% des pannes forcées (rapporté typiquement) |
| Coût de maintenance | Référence | Réduction de 15–30% grâce à un travail basé sur l'état |
| Dossiers | Papier / tableurs | Plateforme intégrée, auditable |
Le contraste est intentionnellement vif — un bon nombre d'organisations relèvent des deux catégories — mais il est parfaitement évident quelle est la tendance et quelle est la preuve dans le cas des études de cas des services publics : passer d'une maintenance traditionnelle à une maintenance basée sur l'état est fondamentalement le plus grand facteur concernant les coûts et la fiabilité dont un propriétaire dispose.
L'économie : Coûts, Économies et Retour sur investissement
| Élément Coût / Valeur | Plage typique | Remarques |
|---|---|---|
| Matériel de surveillance en ligne par unité critique | $15,000–$45,000 | DGA + température + humidité + communication |
| Plateforme d'analytique par unité par an | $500–$2,000 | SaaS ou licence interne |
| Déploiement de flotte pour 50 unités critiques | $800 000–$1 500 000 | Matériel + installation + plateforme + formation |
| Valeur d'une panne forcée évitée (transformateur de puissance important) | $200 000–$1 000 000 | Remplacement, transport, perte d'approvisionnement, pénalités |
| Réduction des coûts de maintenance | 15–30% | Élimination basée sur l'état des travaux inutiles |
| Remboursement global typique | 2–5 ans | Principalement motivé par les pannes évitées |
Les chiffres sont des indicateurs des besoins de planification, pas une indication du devis et peuvent donc varier en fonction de la taille et de l'importance de l'unité. La leçon clé est que le cas commercial pour un investissement dans les big data est basé sur les coûts engendrés par l'évitement des pannes majeures plutôt que sur les économies réalisées grâce à de petites efficacités de maintenance.
Feuille de route de mise en œuvre pour les propriétaires d'actifs
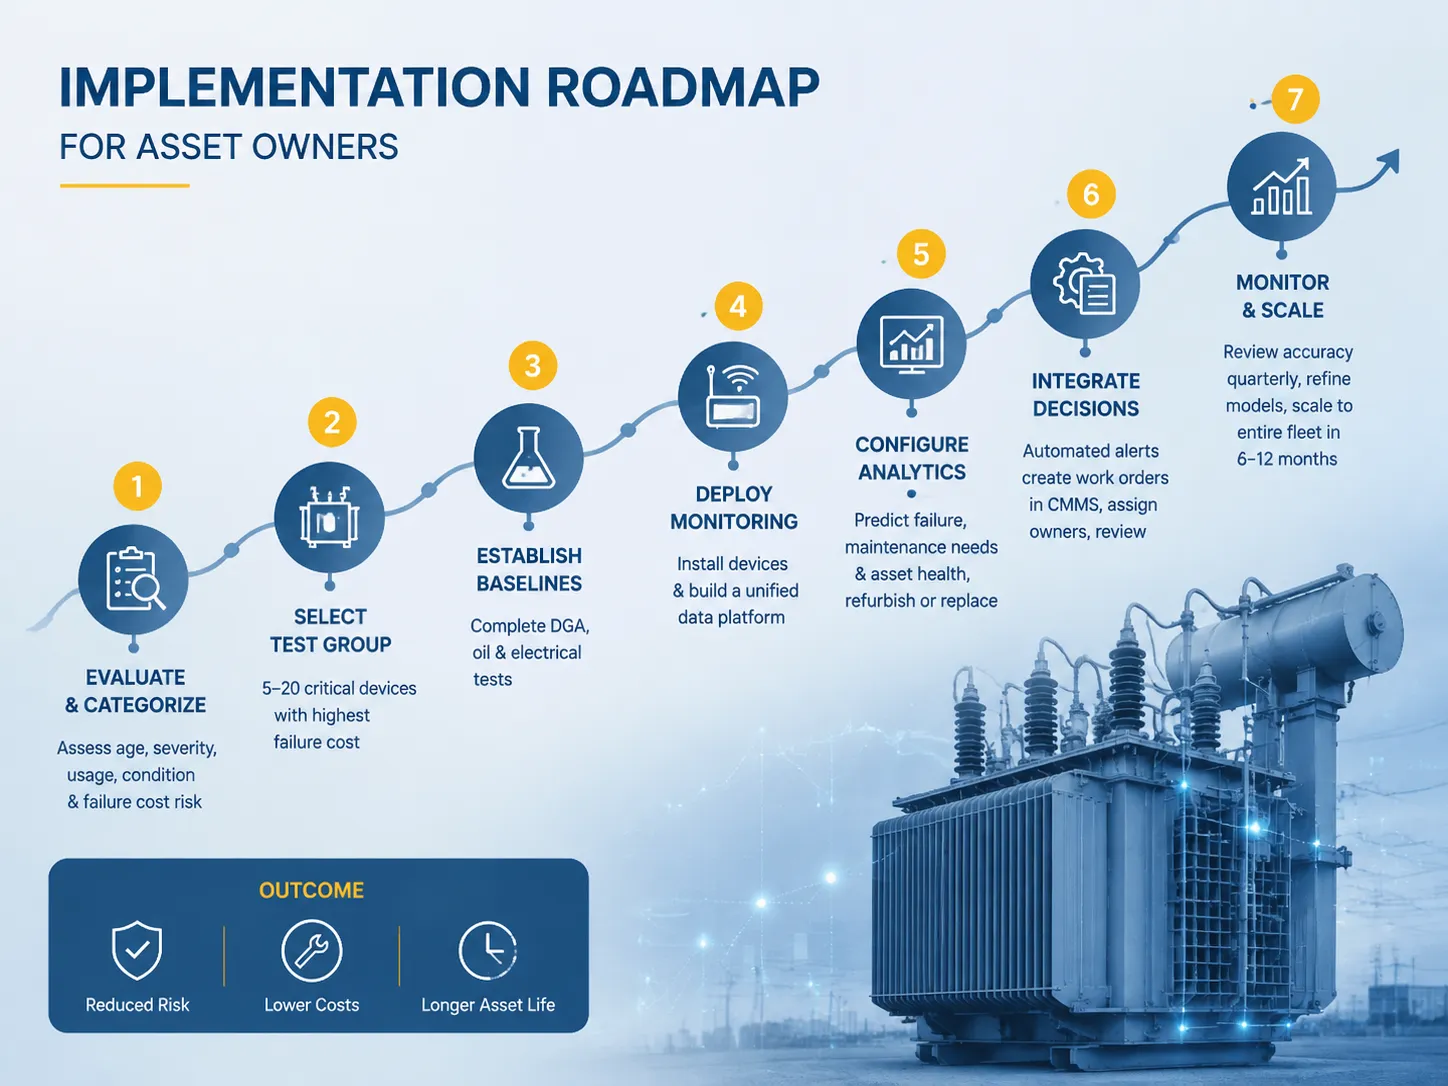
- Évaluez et catégorisez votre flotte. Déterminez l'âge, la gravité, l'utilisation et l'état connu de tous les transformateurs ; évaluez-les par leur risque de coût de défaillance.
- Sélectionnez le groupe de test. Commencez par 5 à 20 dispositifs critiques montrant le coût de dysfonctionnement le plus élevé et pour lesquels les données de surveillance auront une grande importance.
- Établissez des références. Effectuez des tests complets des transformateurs et obtenez des références DGA, huile et électriques avant l'installation de tout outil de surveillance.
- Introduisez des outils de surveillance et de mise en réseau. Configurez des dispositifs de surveillance pour le groupe de test ; assurez-vous que les données seront accumulées dans une base de données historique unique.
- Configurez l'analytique pour répondre à trois questions. Quel dispositif va échouer ensuite ? Quand une maintenance sera-t-elle nécessaire et quel est l'état de l'équipement ? Quand l'équipement doit-il être rénové ou remplacé ?
- Intégrez le processus de prise de décision dans le processus de travail. Les notifications doivent générer des ordres de travail dans le CMMS, pas simplement des tableaux de bord ; les responsabilités doivent être assignées et des examens effectués.
- Surveillez les résultats, développez des méthodes efficaces et avancez. Effectuez une analyse de la précision des prévisions une fois par trimestre, ajustez les modèles et recherchez des possibilités de les appliquer à l'ensemble de la flotte après 6 à 12 mois.
Le rôle du fabricant : Données qui commencent à l'usine
Le cycle de vie des big data est significativement affecté par l'âge des données, qui proviennent de l'usine. L'architecture numérique se compose des lectures des caractéristiques physiques du produit, des points de fin de séchage, des enroulements et des mesures du noyau, ainsi que des informations sur les résultats des tests qui fournissent une base essentielle pour d'autres caractéristiques du produit. C'est la raison pour laquelle les acheteurs exigent désormais une traçabilité numérique des approvisionnements : pendant le cycle de vie, il est nécessaire de prendre soin des transformateurs qui ont un enregistrement numérique, faisant des vendeurs des partenaires au lieu de simplement fournir une boîte rectangulaire.
Les vendeurs de transformateurs fournissent désormais également des services de cycle de vie, y compris des plateformes de surveillance, traduisant les indicateurs DGA au nom du vendeur de l'équipement puisqu'ils possèdent des connaissances en conception pertinentes. Les acheteurs bénéficient de l'utilisation de leurs conceptions car désormais la signification d'une anomalie sera comprise correctement. Des entreprises de Chine, comme Jiangsu Subian Electric Power, envoient des transformateurs conformes à la norme IEC 60076 et prêts pour la surveillance, facilitant ainsi la création de leur propre gestion du cycle de vie pour les propriétaires de matières premières.
Questions Fréquemment Posées
Combien coûte un programme de gestion des transformateurs de big data ?
Un pilote avec 10 à 20 unités critiques nécessiterait environ 150,000 à 600,000 pour le matériel et l'installation, chaque unité coûtant environ 15,000 à 45,000. Vous devrez également ajouter des coûts de 500 à 2,000 par unité pour les frais annuels de la plateforme d'analytique. Par exemple, vous pouvez vous attendre à ce que l'entreprise engage des dépenses allant de 800,000 à 1,500,000 pour le déploiement sur 50 unités, y compris les frais de formation. Pour vous donner une idée de l'équilibre coût-bénéfice, l'arrêt forcé évité sur un grand transformateur peut apporter des économies d'environ 200,000 à 1,000,000 à une usine de fabrication exploitant une telle unité, fournissant en moyenne un retour sur investissement en 2 à 5 ans.
Quelles données devrais-je collecter pour chaque transformateur ?
Établissez une base de référence de mise en service consistant au moins en un rapport de test complet en usine ; DGA ; qualité de l'huile, résistance d'isolation et résistance des enroulements. En fonctionnement, la charge, la température des enroulements et la température de l'huile supérieure, la tension et tout événement d'alarme doivent être collectés. En cas d'équipement critique, la surveillance en ligne de DGA et d'humidité doit être ajoutée. La pire forme de données historiques est celle des données historiques telles que les chocs de transport, les tendances de tests précédents et les actions de maintenance, car l'analyse des tendances est beaucoup plus puissante que toute mesure unique.
Quelle est la précision des modèles de défaillance prédictive pour les transformateurs ?
Les modèles qui prédisent la performance des transformateurs ne fournissent pas de délais spécifiques ; ils fournissent plutôt des classements de risque. Les rapports de l'industrie confirment que de bons cadres de notation des risques qui intègrent les tendances DGA, les modèles de consommation de chaleur-vie et les statistiques de flotte sont efficaces pour détecter les unités les plus à risque en pratique — les entreprises de services publics affirment avoir capturé la plupart des pannes potentielles à un stade précoce d'avertissement grâce à une surveillance annuelle à constante. La situation s'améliore avec l'accumulation de données de flotte, ce qui est la principale raison de commencer dès que possible l'établissement de paramètres de référence.
Les petites entreprises de services publics avec peu de transformateurs peuvent-elles bénéficier de cette approche ?
En effet, une entreprise de services publics avec 20-30 transformateurs peut encore pratiquer la maintenance basée sur l'état via un échantillonnage annuel et une surveillance en ligne ciblée de 2-3 des unités les plus importantes. Elles peuvent également déployer une plateforme simple ou peu coûteuse pour suivre les tendances. La règle physique ne tient pas compte de la taille de la flotte ; seuls les modèles statistiques doivent être adaptés en fonction de la taille des opérations. Commencez par un protocole simple et un suivi des tendances, car cela est largement suffisant.
Comment la traçabilité numérique du fabricant aide-t-elle à la gestion du cycle de vie ?
Grâce aux données numériques telles que construites, vous pouvez obtenir un point de référence fiable : pertes quantifiées, point de séchage de l'humidité, surveillance de la résistance et données de test complètes fournies par l'usine. Cela permet d'évaluer les résultats de tous les tests par rapport au point de référence, plutôt que sur la base de données génériques — ainsi, la sensibilité aux écarts augmente considérablement. De plus, vous pouvez effectuer une analyse des pannes puisque si un appareil échoue, vous aurez accès aux données de l'usine, ce qui peut réduire les raisons possibles de la panne. C'est la raison pour laquelle de plus en plus de départements d'approvisionnement exigent des fabricants qu'ils fournissent de telles données numériques.
Références
- IEC 60076-1 : Transformateurs de puissance – Partie 1 : Généralités — définit les tests en usine et les données de référence à partir desquelles chaque modèle de cycle de vie commence.
- IEC 60076-17 : Transformateurs de puissance – Partie 17 : Guide pour la spécification des systèmes de surveillance des transformateurs — conseils sur quoi et comment surveiller.
- IEEE C57.140 : Guide pour l'évaluation et le reconditionnement des transformateurs de puissance immergés dans un liquide — méthodologie d'évaluation de la consommation de vie et de l'état.
- IEEE C57.104 : Guide d'interprétation DGA — la base analytique pour l'interprétation des tendances de gaz.
- IEC 60300 (série) : Gestion de la fiabilité — normes de cadre de gestion des actifs et du cycle de vie.
- CIGRÉ — études internationales sur la fiabilité des transformateurs et l'efficacité de la surveillance.
- Jiangsu Subian Electric Power — fabricant de transformateurs conforme à la norme IEC fournissant des dossiers de test numériques et des unités prêtes pour la surveillance.
Conclusion
Une grande méthodologie de gestion du cycle de vie basée sur les données remplace l'instinct par une approche continue fondée sur des preuves pour chaque transformateur, de la fabrication à la retraite. Les technologies ont mûri — technologie de surveillance en ligne, jumeaux numériques, modèles de vieillissement basés sur la physique, analyses de flotte — et des études récentes montrent des améliorations continues du cas commercial : réduction des pannes imprévues de 30-50 % et des coûts de maintenance de 15-30 %, avec un retour sur investissement en 2-5 ans principalement dû à l'évitement des pannes catastrophiques.
- Utilisez l'analyse comparative et les tests pilotes pour les unités les plus importantes.
- Laissez l'état et le risque plutôt que le temps dicter la maintenance.
- Utilisez des modèles basés sur la physique aux côtés des statistiques de flotte plutôt que des données uniquement.
- Intégrez l'analyse dans les ordres de travail et les processus de révision, plutôt que seulement dans les tableaux de bord.
- Achetez des transformateurs avec des dossiers numériques tels que construits — certains fabricants comme Jiangsu Subian Electric Power l'ont fait comme norme.