


Ein Asset-Manager bewertet derzeit das O&M-Budget seiner 400-Transformatoren-Flotte, das gemäß der Anweisung seines Vorstands um 15 Prozent gekürzt werden muss. Das Ziel wird jedoch nicht einfach sein, da es keine Änderungen an den Zuverlässigkeitszielen geben wird. Man neigt dazu, Ölproben zu reduzieren, bestimmte Überholungen auszulassen und einige andere ähnliche Maßnahmen im Namen einer sparsamen Budgetverwaltung zu ergreifen; der Asset-Manager ist sich jedoch aus seiner Erfahrung bewusst, wie sich die Dinge langfristig anders entwickeln – die summierten Gewinne aus der Wartung werden schnell in entsprechende Verluste umgewandelt, die in drei bis fünf Jahren eintreten werden, wenn Notfallersatzbeschaffungen den Asset-Manager mehr kosten würden als der eingesparte Betrag. Die Alternative besteht darin, eine Lebenszyklus-Wartungsstrategie einzuführen, die die Gesamtkosten für jede Wartungsmaßnahme über die Lebensdauer von 30–40 Jahren der Ausrüstung berücksichtigt.
Ihr Leitfaden wird Ihnen helfen, sich mit der Gestaltung und Durchführung der O&M-Strategie vertraut zu machen, die zu den niedrigsten TCO für eine Flotte von Transformatoren führen wird. Sie werden lernen, wie man die TCO-Berechnung organisiert, Ausfalldaten und Zustandsdaten anwendet, um die Ausgaben auf Wartungsmaßnahmen zu konzentrieren, die die höchsten Gewinne über die Lebensdauer der Ausrüstung bringen.
Der Rahmen des TCO
Die Lebenszykluskosten, auch bekannt als Gesamtkosten des Eigentums, beziehen sich auf die Gesamtkosten, die für ein Stück Ausrüstung vom Zeitpunkt des Kaufs bis zur Entsorgung anfallen. Im Fall von Transformatoren wird die TCO-Formel wie folgt ausgedrückt:
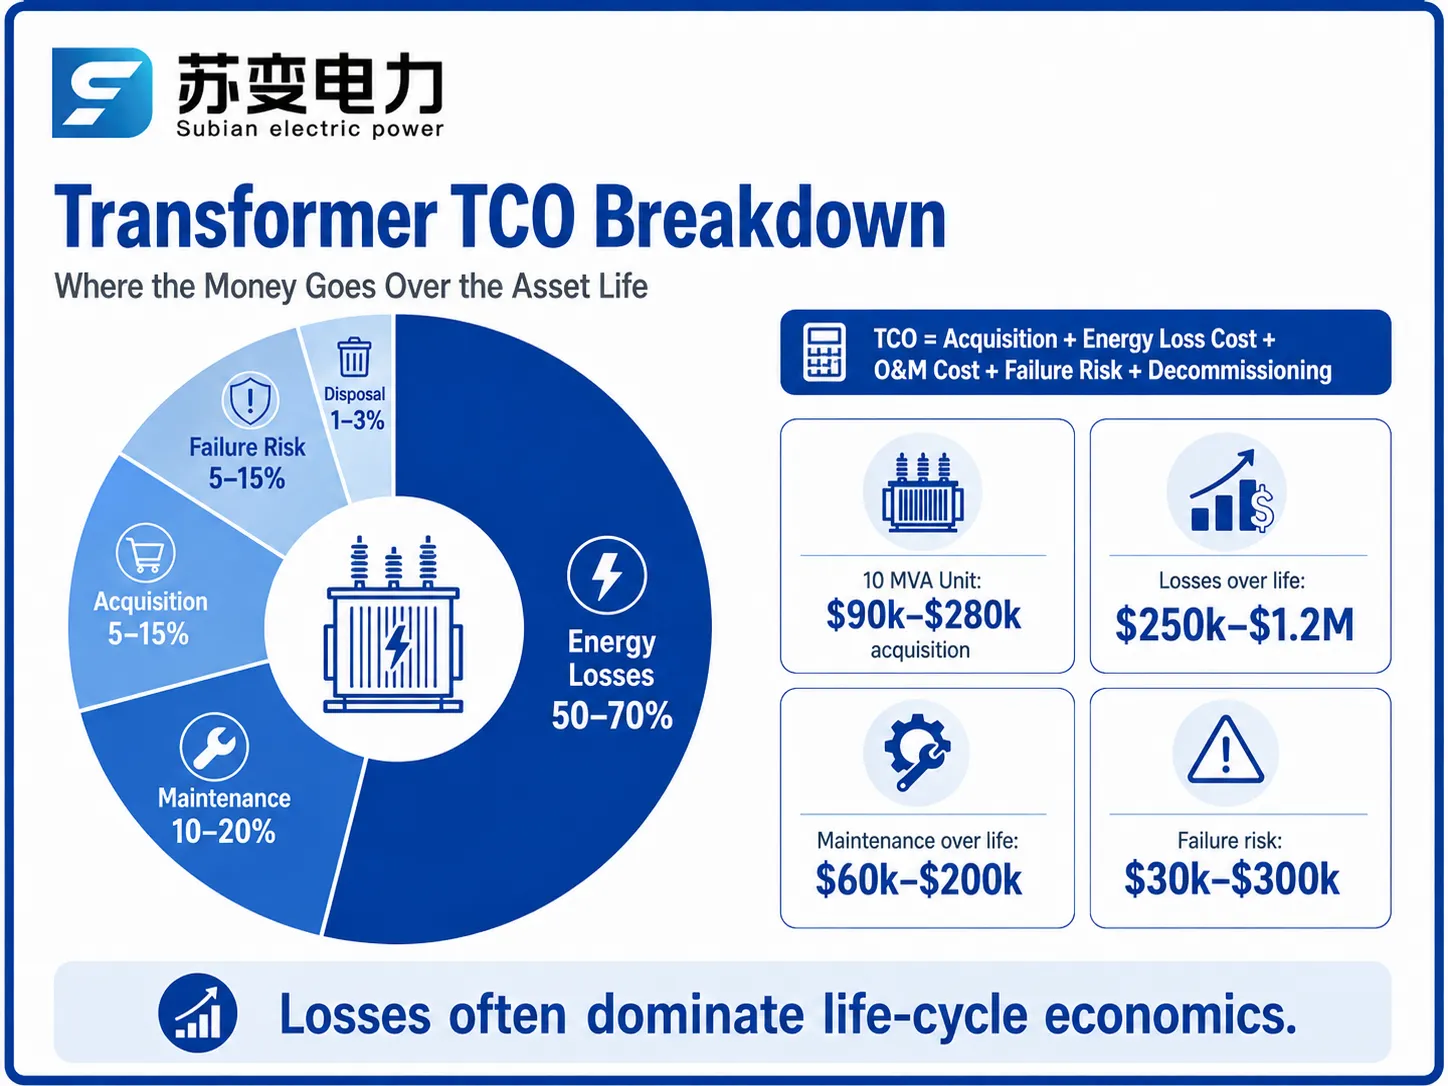
TCO = Anschaffungskosten + Energiekosten + O&M-Kosten + Ausfallrisikokosten + Stilllegungskosten
Jede dieser Variablen hat ihre eigenen Eigenschaften. Die Anschaffungskosten sind einmalig. Die Energiekosten werden in Bezug auf die aktuellen Werte der Verluste berechnet, die das Asset während seiner Betriebszeiten erlitten hat. Die anderen Variablen sind wie folgt: O&M-Kosten sind Gebühren, die für die regelmäßige jährliche Wartung der Transformatoren anfallen, während die Ausfallrisikokosten die erwarteten Kosten darstellen, die durch einen Transformatorausfall entstehen. Stilllegungskosten beziehen sich auf die Ölentsorgung und den Abbau des Transformators und des Tanks.
Die wichtigste Schlussfolgerung aus dem Vergleich dieser Kosten ist, dass die Werte dieser Kosten erheblich von den vorhergesagten abweichen. Im Fall eines typischen Leistungstransformators belaufen sich die Energiekosten über einen Zeitraum von 30 Jahren auf einen Betrag, der 2-5 Mal höher ist als der ursprüngliche Anschaffungspreis, während die Ausfallrisikokosten ebenfalls gleich oder höher als der Anschaffungspreis sein können. Daher wird jeder Ansatz, der entweder den Anschaffungspreis oder die Wartungskosten optimiert, als unangemessen angesehen.
Wo das Geld hingeht: TCO-Aufschlüsselung nach Komponenten
Veröffentlichten Lebenszyklusanalysen und Betriebsabläufen von Versorgungsunternehmen liefern konsistente Informationen darüber, wo Geld für Transformatoren ausgegeben wird. Die genaue Aufschlüsselung variiert je nach Nennleistung, Verlusten, Stromtarifen und Diskontsatz, aber das folgende Muster kann als repräsentativ für einen mittleren Transformator angesehen werden.
| Kostenkomponente | Typischer Anteil der TCO | Typischer absoluter Bereich (10 MVA Einheit) | Kontrollierbar? |
|---|---|---|---|
| Erwerb (Kauf + Installation) | 5–15% | $90.000–$280.000 | Beim Kauf; beinhaltet Verlustausgleiche |
| Energieverluste (Barwert, 30 Jahre) | 50–70% | $250.000–$1,2 Millionen | Ja: Verlustspezifikation, Lade-Disziplin |
| Wartung (regelmäßig + periodisch) | 10–20% | $60.000–$200.000 über die Lebensdauer | Ja: zustandsbasierte Zielsetzung |
| Ausfallrisiko (erwarteter Wert) | 5–15% | $30.000–$300.000 | Ja: Überwachung, Schutz, Überholungen |
| Stilllegung und Entsorgung | 1–3% | $10.000–$50.000 | Teilweise: Öl- und Abfallmanagement |
Die Erkenntnis ist, dass Verluste überwiegen. Ein Unterschied von 10 kW im Leerlaufverlust entspricht einem Wert von $30.000 basierend auf $3.000 pro kW in heutigen Dollar, einem Betrag, der mehreren Jahren Wartungsausgaben entspricht. Ein TCO-orientierter Ansatz berücksichtigt daher sowohl die Verlustspezifikation als auch die Lasten in gleichem Maße wie die Wartungsaktivitäten.
O&M-Strategieoptionen: Reaktiv, Präventiv, Prädiktiv, RCM
O&M-Strategien existieren auf einem Spektrum, und jede hat ein Kostenprofil:
| Strategie | Ansatz | Relative O&M-Kosten | Ausfallrisiko | Am besten geeignet für |
|---|---|---|---|---|
| Reaktiv (Lauf-bis-Ausfall) | Nur reparieren, wenn es ausfällt | Niedrigste Wartung, höchste Ausfallkosten | Hoch | Niedrig-kritische, günstige, ersetzbare Einheiten |
| Präventiv (kalenderbasiert) | Feste Intervalle für Tests und Überholungen | Mittel; verschwenderisch bei gesunden Einheiten | Mittel | Altbestände ohne Zustandsdaten |
| Prädiktiv (zustandsbasiert) | Tests und Maßnahmen, die durch den Zustand gesteuert werden | Mittel; gezielte Ausgaben | Niedriger | Mittel- und kritische Einheiten mit DGA-Programmen |
| Zuverlässigkeitsorientiert (RCM) | Fehlermodi-Analyse pro Einheit | Optimiert; höchster Ingenieureinsatz | Niedrigste | Kritische Übertragungsgüter |
Die Mehrheit der Flotten stellt fest, dass der hybride Ansatz zur TCO am effektivsten ist, wobei der Großteil der Einheiten durch prädiktive/Zustandswartung gewartet wird, während reaktive Wartung nur für Einheiten mit geringem Wert geeignet ist, und die RCM-Methodik in wenigen außergewöhnlichen Einheiten implementiert wird, bei denen ein Verlust verheerend wäre. Die Stärke dieses Ansatzes liegt in der Segmentierung, anstatt einen Ansatz für alle Anwendungen zu wählen.
Zustandsbasierte Wartung in der Praxis
Zustandsbasierte Wartung (CBM) ist das Prinzip eines TCO-basierten Wartungssystems, da es darauf abzielt, nur in Bereichen zu investieren, in denen Abnutzung vorhanden ist. In der Praxis verwendete Techniken mit ihren Kostenwerten:
– DGA gemäß IEEE C57.104/IEC 60599 Standard kostet etwa $200-500 pro Probe. Proben werden einmal im Jahr als Basislinie und häufiger durchgeführt, wenn es Erhöhungen im Gaswert gibt. Dies ist der wertvollste Test, der in Bezug auf die ausgegebenen Mittel berechnet wird.
– Ölqualitätsprüfungen: Durchschlagspannung, Feuchtigkeit, Säuretest bieten ein Paket von Dienstleistungen, das $150-400 kostet und die Kontaminationsdetektion vor dem Auftreten von Isolationsfehlern ermöglicht.
– Elektrische Tests: Isolationswiderstand, Verhältnis, Wicklungswiderstandstests kosten $300-1500 pro Einheit und Zyklus und helfen, Wicklungs- und Isolationsverschlechterungen zu erkennen.
– Teilentladungstests, wie im Fall von kritischen Einheiten oder wenn DGA zeigt, dass eine Entladungsaktivität stattfindet, kosten zwischen $1500 und $8000 pro Einheit.
– Online-Überwachung, die zwischen $25000 und $120000 pro kritischer Einheit kostet, ist in den Fällen anwendbar, in denen die Kosten für Wartungsstillstand die Ausgaben rechtfertigen.
Die Bedeutung der CBM-Regel ist sehr klar: Man sollte den minimalen Betrag für Tests ausgeben, um das Niveau der Unsicherheit über den Zustand der Einheit akzeptabel zu halten, und dann die Daten für Maßnahmen nutzen. Das Ergebnis der Anwendung von CBM auf alle Geräte ist in der Regel eine Gesamtkostenreduktion der Wartung um 15-30% im Vergleich zur präventiven Wartung und geringere Ausfallzeiten.
Wirtschaftliche Entscheidungsregeln: Reparieren, Stilllegen oder Ersetzen
Alle wichtigen Entdeckungen stellen die gleiche wirtschaftliche Frage: ob man das Objekt reparieren, aufgeben oder ersetzen soll. Es muss entschieden werden, ob die Alternativen über ihren gesamten Lebenszyklus günstiger sind.
Berechnen Sie die Kosten für jede mögliche Option zum Barwert: Reparaturpreis und die Kosten für Wartung und Ausfallrisiko über die verbleibende Lebensdauer; Ersatzkosten (neue Ausrüstung und zusätzliche Verluste und Wartung) abzüglich des Schrottpreises der alten Ausrüstung.
Begrenzen Sie die Verluste auf $2.000–$7.000/kW Leerlaufleistung und $500–$1.500/kW Last. Eine alte Hochverlust-Einheit kann typischerweise mehr Betriebskosten verursachen als eine Neuanschaffung, selbst wenn sie noch funktionsfähig ist, da die Kosten für Verluste höher sind als die für den Ersatz.
Wenden Sie die 50–70%-Regel an: Wenn die Reparaturkosten mehr als 50–70% der Ersatzkosten betragen oder wenn die Reparatur ein hohes Risiko für nachfolgende Ausfälle mit sich bringt, ist es besser, alte Geräte zu ersetzen.
Bedenken Sie, dass die verbleibende Lebensdauer ein wichtiger Faktor ist: Ein gewartetes 10 Jahre altes Gerät wird in der Regel repariert; ein 35 Jahre altes Gerät mit ordnungsgemäß bestätigtem Papieralter wird traditionell ersetzt, selbst wenn die Reparatur heute weniger kostet.
Berücksichtigen Sie den Ausfallwert aus Gründen der Wichtigkeit: Bei kritischen Einheiten können die Ersatzkosten gerechtfertigt sein, unter der Annahme, dass eine neue Einheit eine geringere Ausfallwahrscheinlichkeit hat, selbst wenn die Rechnung ausgeglichen bleibt.
Man sollte beachten, dass die Anwendung dieser Regeln durch Versorgungsunternehmen zeigt, dass die sogenannte vorzeitige Stilllegung alter Hochverlust-Einheiten in der Tat die beste Lösung in Bezug auf die Gesamtkosten des Eigentums ist, da die Einsparungen durch den Verlust der neuen Einheit die meisten Kosten des Ersatzes decken. Ein Beispiel basierend auf einem vereinfachten 10 MVA-Vergleich über 25 Jahre wird unten gegeben.
| Artikel (10 MVA Einheit, 25-Jahres-Horizont) | Alte Einheit behalten | Mit neuer ersetzen |
|---|---|---|
| Leerlaufverlust | 25 kW | 12 kW |
| Kapitalisierter Verlustwert ($3.000/kW) | $75,000 | $36,000 |
| Jährliche Wartung | $8.000, steigend | $3,000 |
| Ersatzkapital | — | $150,000 |
| Ausfallrisiko | Steigend, 2–5%/Jahr | 0,5–1%/Jahr |
Der Lebenszyklus von Transformatoren und Kostenfallen in jeder Phase
Jede Phase des Lebenszyklus eines Transformators hat ihre eigene Kostenfalle:
| Stufe | Typische Dauer | Hauptkostenfalle | TCO-basierte Gegenmaßnahme |
|---|---|---|---|
| Beschaffung | 3–9 Monate | Nur nach Preis kaufen; Hochverlust-Einheiten binden Jahrzehnte an Kosten | Kapitalisierte Verluste im Angebot bewerten |
| Inbetriebnahme | Tage bis Wochen | Eilige Installation, Tests überspringen, nasses Öl akzeptieren | Bestehen Sie auf vollständigen Inbetriebnahmeprüfungen und Öl-Kriterien |
| Frühe Lebensdauer (0–5 Jahre) | 5 Jahre | Kinderkrankheiten durch Verarbeitung; keine Basislinie DGA | Basislinie DGA in den Monaten 6 und 18, Garantieverfolgung |
| Lebensmitte (5–20 Jahre) | 15 Jahre | Selbstzufriedenheit; Probenahme gedehnt, Trends verpasst | Zustandsbasierte Tests mit Anstiegsalarmen |
| Späte Lebensphase (20–40 Jahre) | 20 Jahre | Unangemessene Erhaltung veralteter, verlustreicher Einheiten | Ersatzanalyse mit kapitalisierten Verlusten |
| Lebensende | — | Unsachgemäße Ölentsorgung und Standortkontamination | Entsorgungsplanung mit Ölrecycling und Materialrückgewinnung |
Flottenbudgetierung und Priorisierung
Eine TCO-Strategie funktioniert auf Flottenebene, wo Risiko und Budget aufeinandertreffen. Der praktische Ansatz ist folgender:
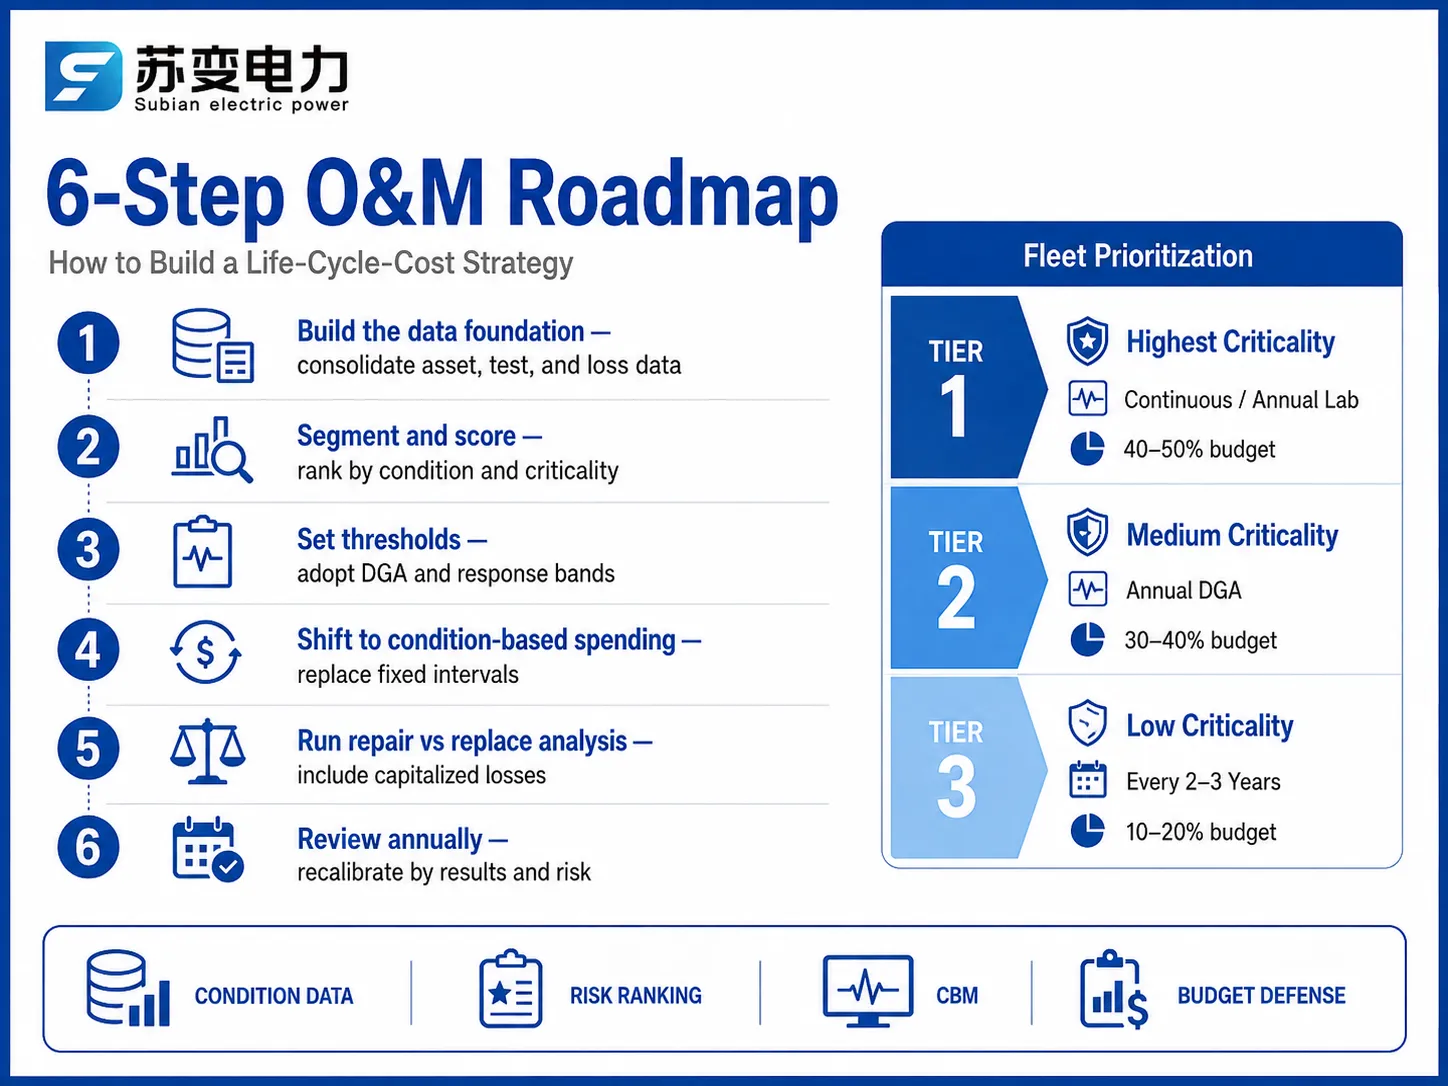
Segmentieren Sie die Flotte basierend auf den Kritikalitätsstufen (Verlustauswirkung), Zustand, Alter, Verlust usw. Berechnen Sie den Zustandswert für jedes Asset unter Verwendung von DGA, Ölanalysen, elektrischen Tests, Alter und Lastverfolgung (jährlich aktualisiert). Rangieren Sie die Assets basierend auf Risiko = Zustandswert × Kritikalität × Verlustfolge. Verteilen Sie das O&M-Budget entlang der rangierten Positionen (z. B. vollständige Überwachung für die oberste Kategorie, jährliche DGA für die mittlere Kategorie und längere Zeit für das niedrige Risiko) um eine Warteschlange von Ersatzteilen aus dem schlechtesten Zustand, den teuersten Verlusten gemäß den eingesparten Kosten aus dem Wartungsbudget zu erstellen.
Eine dreistufige Segmentierung hält das Budget im Verhältnis zum Risiko:
| Ebene | Kritikalität | Überwachungsstufe | Testfrequenz | Anteil am O&M-Budget |
|---|---|---|---|---|
| 1 | Höchste (Übertragung, Einnahmen) | Online-Suite | Kontinuierlich + jährliches Labor | 40–50% |
| 2 | Mittel (Verteilungsstationen) | Jährliche DGA | Jährlich; halbjährlich bei Abweichungen | 30–40% |
| 3 | Niedrig (nicht kritisch, redundant) | Grundöltest | Alle 2–3 Jahre | 10–20% |
Dieser Ansatz ermöglicht es einem Versorgungsunternehmen, jeden Dollar zu verteidigen: Ausgaben folgen dem Risiko, und die Spitze der Warteschlange ist immer die Einheit mit der schlechtesten Kombination aus Zustand und Folge.
Datenanforderungen für eine TCO-basierte Strategie
Egal wie clever das entworfene Design ist, es kann ohne Daten nicht umgesetzt werden. Hier sind die minimalen Aktivitäten unter dem Transformator:
Asset-Identität: Bewertung, Spannungen, Hersteller, Inbetriebnahmedatum, Seriennummer.
Verluste: spezifizierte und gemessene Leerlauf- und Lastverluste.
Geschichte: alle DGA-Aufzeichnungen, Ölqualität und elektrische Testergebnisse sowie Reparaturen und Überlastereignisse mit Daten und Bedingungen.
Lastprofil: Spitzenlast, Lastfaktor oder mindestens Spitze pro Jahr und gelieferte Energie.
Aufzeichnungen über Ausfälle und Störungen mit Ursachen.
Kostendaten: Anschaffungs-, Wartungskosten, Ausfälle.
Umsetzung der Strategie: Ein 6-Schritte-Fahrplan
Schaffung einer Datenbasis: Kombinieren Sie Asset-Aufzeichnungen und Testaufzeichnungen in einem einzigen System und schließen Sie die Lücken mithilfe von Erstproben über einen Zeitraum von 12-18 Monaten.
Segmentierung und Berechnung: Definieren Sie die Bedeutung und messen Sie Zustandswerte für die gesamte Flotte.
Festlegung von Schwellenwerten und Reaktionen: Verwenden Sie die IEEE C57.104 / IEC 60599-Standards für Messschwellen mit unterschiedlichen Reaktionsstufen und verantwortlichen Personen.
Übergang zu einem hybriden Modell: Wenden Sie anstelle fester Intervalle die Testfrequenz basierend auf Risiken an.
Durchführung von Ersatzmaßnahmen: Wenden Sie berechnete Verluste und die Überprüfung der Regeln an, wann Einheiten mit sehr hohen Verlustquoten repariert werden sollen.
Jährliche Analyse: Ergebnisse der vorhergesagten Maßnahmen im Vergleich zu den tatsächlichen Ergebnissen offenlegen und die Schwellenwerte anpassen.
Kostenfallen und wie man sie vermeidet
- Der Akt der Maximierung von Einsparungen in der Wartungsoptimierung: Die Ausfallzeiten der Transformatorenschutzabteilung zu senken und Verluste aufgrund von Fehlfunktionen zu vermeiden, könnte dem Budget des Unternehmens helfen, etwa $300 pro Jahr zu sparen, während es…$250.000 aufgrund des Ausfalls kostet. Wie gesagt, entwickeln und passen Sie Wartungsmaßnahmen entsprechend den damit verbundenen Ausfallrisiken an.
Ignorieren der Verlustintegration im Entscheidungsprozess: Bei der Beibehaltung der alten und schlecht funktionierenden Hochverlustmaschinen könnten die Verluste höher sein als alle finanziellen Ausgaben, die mit ihrem Ersatz verbunden sind.
Falsche Rabatt- oder Tarifberechnungen: Die Kapitalisierung oder Abzinsung von Werten ändert sich entsprechend den Strompreisen und Rabattätzen; stellen Sie sicher, dass Sie die Annahmen Ihrer Berechnungen dokumentieren und diese für die erneute Berechnung und Modellierung verwenden, wenn die Tarife korrigiert werden müssen.
Ignorieren der Folgen von Ausfällen: Kostenberechnungsmodelle, die den Produktionsverlust aufgrund von fehlerhaftem Equipment und Strafen für Ausfälle auslassen, unterschätzen den Bedarf an Schlüsselmaschinen.
Mangel an Datenkontinuität: Eine Strategie, die auf unkontrollierten und unkoordinierten Daten basiert, führt zu falschen Ranglisten und unbegründeten Budgets.
Häufig gestellte Fragen
Was bedeutet die Gesamtkostenbetrachtung für einen Transformator?
TCO ist der Barwert aller Kosten über die Lebensdauer des Vermögenswerts: Anschaffung, Energieverluste, O&M, erwartete Ausfallkosten und Entsorgung. Bei einem Leistungstransformator machen die Energieverluste typischerweise 50–70 Prozent der TCO aus, was den Kaufpreis bei weitem übersteigt, weshalb die Verlustspezifikation und die Lastdisziplin die Lebenszykluskosten dominieren.
Wie berechnet man die Lebenszykluskosten für einen Transformator?
Summieren Sie den Barwert von: Kauf und Installation; jährlichen Verlustkosten (Leerlaufverlust × Stunden × Tarif, plus Lastverlust × Lastfaktor² × Stunden × Tarif, abgezinst über die Lebensdauer); jährliche O&M; erwartete Kosten bei Ausfall (Ausfallwahrscheinlichkeit × Konsequenz); und Entsorgung. Verwenden Sie einen Diskontsatz von 5–10 Prozent und eine Lebensdauer von 25–40 Jahren.
Was ist ein angemessenes jährliches Wartungsbudget pro Transformator?
Für einen Mittelspannungstransformator kostet ein vollständiges zustandsbasiertes Programm, tägliche Rundgänge, jährliche DGA, Ölqualität und elektrische Tests etwa $1.500–$5.000 pro Jahr. Kritische Einheiten mit Online-Überwachung fügen $25.000–$120.000 an Kapital hinzu. Im Vergleich zu einem Ersatzkosten von $250.000–$1,5 Millionen ist dieses Budget eine kleine Versicherung.
Wann sollte ein Transformator ersetzt und nicht repariert werden?
Ersetzen, wenn die Reparatur 50–70 Prozent der Ersatzkosten übersteigt, wenn die verbleibende Lebensdauer der Einheit kurz ist (typischerweise über 30–35 Jahre mit bestätigtem Isolationsalterung) oder wenn die kapitalisierten Einsparungen durch Verlust und das geringere Ausfallrisiko den Ersatz im Barwert günstiger machen. Das Alter allein ist nicht das Kriterium; Zustand und Verlustökonomie sind entscheidend.
Wie viel kosten die Verluste eines Transformators über die Lebensdauer des Vermögenswerts?
Ein 10 MVA Transformator, der bei typischer Last etwa 30 kW verliert, kostet etwa $20.000–$50.000 pro Jahr an Verlusten bei $0,10–$0,14/kWh, was $300.000–$750.000 über einen Bewertungszeitraum von 20 Jahren in Barwert darstellt, oft mehr als der Kaufpreis. Kapitalisierte Verlustwerte von $2.000–$7.000/kW Leerlauf und $500–$1.500/kW Last sind in der Ausschreibungsevaluation von Versorgungsunternehmen Standard.
Referenzen
- IEC 60076-1: Leistungstransformatoren — Allgemeines — Die Standardbasis für Bewertungen, Verluste und Effizienzdaten, die in der Lebenszyklusevaluation verwendet werden.
- IEC 60076-7: Lastleitfaden für ölgefüllte Transformatoren — Der Referenzwert für Last, Temperatur und Alterung, der die Verlustkostenmodelle speist.
- IEC 60422: Aufsicht und Wartungsleitfaden für mineralische Isolieröle — Ölüberwachungs- und Wartungsgrenzen, die in zustandsbasierten Programmen verwendet werden.
- IEEE C57.104: Leitfaden zur Interpretation von Gasen, die in ölgetauchten Transformatoren erzeugt werden — DGA-Schwellenwerte, die die Zustandsbewertung und Wartungsentscheidungen beeinflussen.
- CIGRÉ — Technische Broschüren zum Asset-Management von Transformatoren, Lebenszykluskosten und Entscheidungen am Lebensende.
- IEEE — Zuverlässigkeitsumfragen und Daten zur Wartungsökonomie von IEEE-Arbeitsgruppen.
- Jiangsu Subian Electric Power — IEC 60076-konformer Transformatorenhersteller, der verlustarme Designs und TCO-fokussierte Beschaffung unterstützt.
Fazit
Der O&M-Plan für die O&M von Transformatoren, der auf Lebenszykluskosten basiert, stützt sich auf Berechnungen und nicht auf Instinkt. Er klassifiziert die Flotte und leitet die Wartungskosten je nach Zustand und Bedeutung; er bewertet Reparaturen/Ersatz durch kapitalisierte Verluste und bricht das Budget jedes Jahr gemäß den in der Praxis erzielten Ergebnissen auf. Das Ergebnis ist ein Budget mit Verteidigung und ein Zuverlässigkeitsprofil mit sinkenden Kosten.
Entscheidungen auf der Grundlage von TCO treffen.
Übergang von kalenderorientierten zu zustandsorientierten Ausgaben.
Ersetzen und Reparaturen im Hinblick auf den kapitalisierten Verlustbetrag berücksichtigen.
Die Maschinen klassifizieren und sie entsprechend ihrem Zustand, ihrer Bedeutung und ihren Konsequenzen einstufen.
Daten über den Zustand während der gesamten Lebensdauer aufbewahren.
Für erneuerte Flotten sind Niedrigverlust-Transformator-Designs der größte TCO-Hebel, der zur Verfügung steht. Jiangsu Subian Electric Power stellt IEC 60076-konforme Transformatoren bis zu 110 kV mit Verlustniveaus her, die für die kapitalisierte Bewertung geeignet sind, und hilft Eigentümern, die Lebenszykluskosten zu minimieren. Fordern Sie eine Spezifikation und ein Verlustangebot an unter subian-electric.com.