


Менеджер активов в настоящее время оценивает бюджет O&M для своего парка из 400 трансформаторов, который необходимо сократить на 15 процентов по указанию совета директоров. Однако цель не будет легкой, поскольку нет изменений в целевых показателях надежности. Есть склонность сократить отбор образцов масла, пропустить определенные капитальные ремонты и предпринять некоторые другие аналогичные шаги в целях экономии бюджета; однако менеджер активов знает из своего опыта, как в долгосрочной перспективе все обстоит иначе – суммарные выгоды от обслуживания быстро превращаются в соответствующие убытки, которые проявятся через три-пять лет, когда экстренные замены обойдутся менеджеру активов дороже, чем сэкономленная сумма. Альтернатива – внедрить стратегию обслуживания на протяжении жизненного цикла, которая учитывает общие затраты на каждую меру обслуживания на протяжении 30–40 лет срока службы оборудования.
Ваше руководство поможет вам ознакомиться с тем, как разработать и реализовать стратегию O&M, которая приведет к наименьшим TCO для парка трансформаторов. Вы узнаете, как организовать расчет TCO, применить данные о сбоях и данные о состоянии, чтобы сосредоточить расходы на мерах обслуживания, которые принесут наибольшие выгоды на протяжении срока службы оборудования.
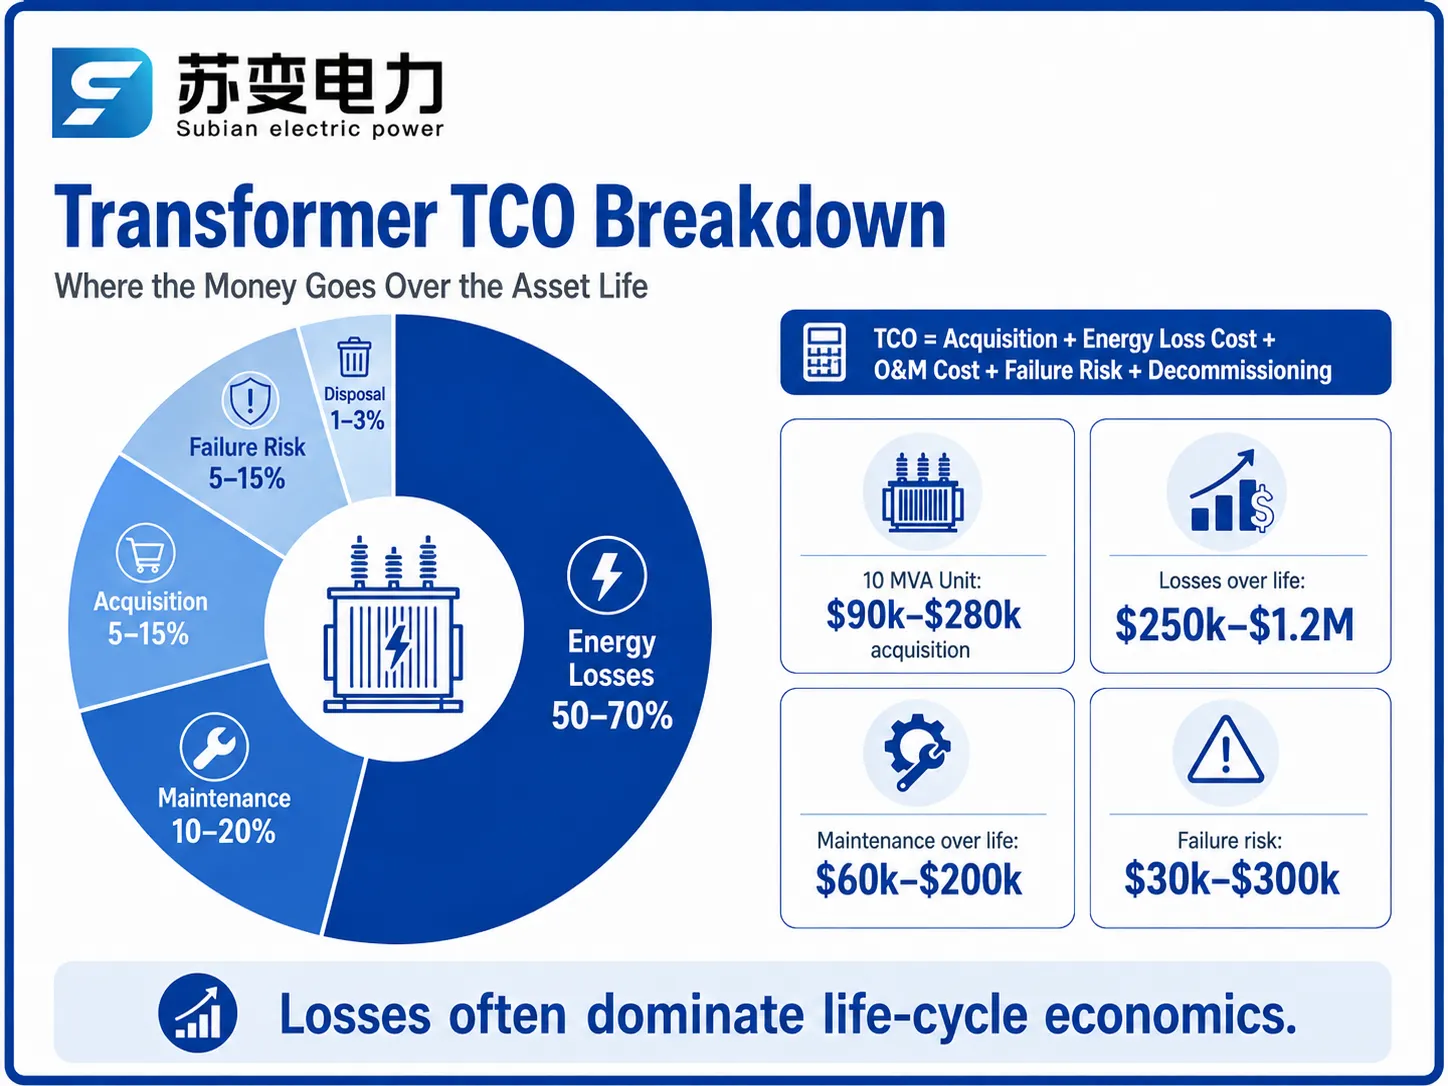
Структура TCO
Расчет жизненного цикла, также известный как общая стоимость владения, относится к общим затратам, понесенным за единицу оборудования с момента его покупки до момента его утилизации. В случае трансформаторов формула TCO выражается следующим образом:
TCO = Стоимость приобретения + Стоимость потерь энергии + Стоимость O&M + Стоимость риска отказа + Стоимость демонтажа
Каждая из этих переменных имеет свои характеристики. Стоимость приобретения является единовременной. Стоимость потерь энергии рассчитывается в терминах текущих значений потерь, понесенных активом в течение его эксплуатационного периода. Остальные переменные следующие: затраты на O&M – это расходы, понесенные на регулярное ежегодное обслуживание трансформаторов, в то время как стоимость риска отказа – это ожидаемые затраты, понесенные в результате отказа трансформатора. Стоимость демонтажа подразумевает утилизацию масла и разборку трансформатора и резервуара.
Основной вывод, сделанный на основе сравнения этих затрат, заключается в том, что значения этих затрат значительно отличаются от предсказанных. В случае типичного силового трансформатора стоимость потерь энергии за 30-летний период составляет 2-5 раз больше первоначальной цены приобретения, в то время как затраты на риск отказа могут также быть равны или выше цены приобретения. Поэтому любой подход, который оптимизирует только цену приобретения или затраты на обслуживание, считается неуместным.
Куда уходят деньги: Распределение TCO по компонентам
Опубликованные анализы жизненного цикла и операции коммунальных служб предоставляют последовательную информацию о том, куда тратятся деньги на трансформаторы. Точное распределение варьируется в зависимости от номинальной мощности, потерь, тарифов на электроэнергию и ставок дисконтирования, но следующая схема может рассматриваться как репрезентативная для среднего трансформатора.
| Компонент затрат | Типичная доля TCO | Типичный абсолютный диапазон (блок 10 МВА) | Контролируемый? |
|---|---|---|---|
| Приобретение (покупка + установка) | 5–15% | $90,000–$280,000 | При покупке; включает компенсацию потерь |
| Энергетические потери (текущая стоимость, 30 лет) | 50–70% | $250,000–$1.2 миллиона | Да: спецификация потерь, дисциплина загрузки |
| Обслуживание (рутинное + периодическое) | 10–20% | $60,000–$200,000 за весь срок службы | Да: целевая установка на основе состояния |
| Риск отказа (ожидаемая стоимость) | 5–15% | $30,000–$300,000 | Да: мониторинг, защита, капитальный ремонт |
| Вывод из эксплуатации и утилизация | 1–3% | $10,000–$50,000 | Частично: управление маслом и отходами |
Основной вывод заключается в том, что потери преобладают. Разница в 10 кВт в потере без нагрузки переводится в сумму $30,000 на основе $3,000 за кВт в сегодняшних долларах, что эквивалентно нескольким годам расходов на обслуживание. Таким образом, подход, ориентированный на TCO, учитывает как спецификацию потерь, так и загрузку в равной степени с деятельностью по обслуживанию.
Опции стратегии O&M: Реактивная, Профилактическая, Прогностическая, RCM
Стратегии O&M существуют на спектре, и каждая имеет профиль затрат:
| Стратегия | Подход | Относительная стоимость O&M | Риск отказа | Лучше всего для |
|---|---|---|---|---|
| Реактивная (работа до отказа) | Ремонт только при отказе | Наименьшие затраты на обслуживание, наивысшие затраты на отказ | Высокий | Низкокритичные, дешевые, заменяемые единицы |
| Профилактическая (по календарю) | Испытания и капитальные ремонты через фиксированные интервалы | Средняя; расточительная для здоровых единиц | Средняя | Устаревшие парки без данных о состоянии |
| Прогностическая (по состоянию) | Испытания и действия, основанные на состоянии | Средний; целевые расходы | Ниже | Средние и критические единицы с программами DGA |
| Ориентированный на надежность (RCM) | Анализ режимов отказов по единице | Оптимизированный; максимальные инженерные усилия | Наименьший | Критические активы передачи |
Большинство флотов считают, что гибридный подход к TCO является наиболее эффективным, при котором основная часть единиц обслуживается с помощью предсказательного/условного обслуживания, в то время как реактивное обслуживание подходит только для низкоценностных единиц, а методология RCM применяется в нескольких исключительных единицах, где потеря была бы разрушительной. Сила этого подхода заключается в сегментации, а не в универсальном подходе к применению.
Обслуживание на основе состояния на практике
Обслуживание на основе состояния (CBM) является принципом системы обслуживания на основе TCO, поскольку оно направлено на инвестиции в обслуживание только в тех областях, где присутствует износ. Используемые на практике методы с их стоимостью:
– DGA согласно стандарту IEEE C57.104/IEC 60599 составляет около $200-500 за образец. Образцы берутся раз в год как базовые и чаще, если наблюдаются какие-либо увеличения в значении газа. Это самый ценный тест, рассчитанный с точки зрения потраченных денег.
– Тесты качества масла: пробивное напряжение, влажность, тест на кислотность предоставляют пакет услуг стоимостью $150-400, обеспечивая обнаружение загрязнения до того, как оно приведет к отказу изоляции.
– Электрические тесты: тесты сопротивления изоляции, соотношения, сопротивления обмотки стоимостью $300-1500 за единицу за цикл помогают обнаружить ухудшение состояния обмотки и изоляции.
– Тесты частичных разрядов, как в случае критических единиц или если DGA показывает, что происходит какая-либо разрядная активность, стоят от $1500 до $8000 за единицу.
– Онлайн-мониторинг стоимостью от $25000 до $120000 за критическую единицу применим в тех случаях, когда стоимость простоя обслуживания оправдывает расходы.
Смысл правила CBM очень ясен: необходимо тратить минимальную сумму, необходимую для тестирования, чтобы уровень неопределенности относительно состояния единицы оставался приемлемым, а затем использовать данные для действий. Результат применения CBM ко всему оборудованию обычно заключается в снижении общих затрат на обслуживание на 15-30% по сравнению с профилактическим обслуживанием и меньшими простоями.
Экономические правила принятия решений: Ремонт, Списание или Замена
Все важные открытия требуют одного и того же экономического вопроса: стоит ли ремонтировать, списывать или заменять работу объекта. Необходимо определить, являются ли альтернативы дешевле на протяжении всего их жизненного цикла.
Рассчитайте затраты для каждой возможной опции в текущей стоимости: цена ремонта и стоимость обслуживания и риск отказа на оставшийся срок службы; стоимость замены (новое оборудование и дополнительные потери и обслуживание) минус цена утилизации старого оборудования.
Ограничьте потери до $2,000–$7,000/kW без нагрузки и $500–$1,500/kW под нагрузкой. Старая единица с высокими потерями может стоить больше в эксплуатации, чем замена, даже если она все еще функциональна, потому что стоимость потерь выше, чем стоимость замены.
Примените правило 50–70%: если стоимость ремонта превышает 50–70% от стоимости замены, или если ремонт сопряжен с высоким риском последующих отказов, лучше заменить старое оборудование.
Имейте в виду, что оставшийся срок службы является важным фактором: обслуживаемое 10-летнее оборудование обычно будет отремонтировано; устройство 35 лет с должным образом подтвержденным бумажным старением традиционно будет заменено, даже если ремонт стоит меньше сегодня.
Учитывайте стоимость простоя ради важности: для критических единиц стоимость замены может быть оправдана при условии, что новая единица имеет меньшую вероятность отказа, даже если арифметика остается сбалансированной.
Следует отметить, что применение этих правил коммунальными компаниями показывает, что так называемое преждевременное списание старых высокопотерьных единиц является, на самом деле, лучшим решением с точки зрения общей стоимости владения, поскольку экономия на потерях новой единицы покрывает большую часть затрат на замену. Пример на основе упрощенного сравнения 10 МВА на 25 лет приведен ниже.
| Пункт (единица 10 МВА, горизонт 25 лет) | Сохранить старую единицу | Заменить на новую |
|---|---|---|
| Потребление без нагрузки | 25 кВт | 12 кВт |
| Капитализированная стоимость потерь (3,000 руб./кВт) | $75,000 | $36,000 |
| Годовое обслуживание | 8,000 руб., растущее | $3,000 |
| Капитал замены | — | $150,000 |
| Риск отказа | Растущий, 2–5%/год | 5–1%/год |
Жизненный цикл трансформатора и ловушки затрат на каждом этапе
Каждый этап жизненного цикла трансформатора имеет свою ловушку затрат:
| Этап | Типичная продолжительность | Основная ловушка затрат | Контрмеры на основе TCO |
|---|---|---|---|
| Закупка | 3–9 месяцев | Покупка только по цене; высокопотерьные единицы блокируют десятилетия затрат | Оцените капитализированные потери в тендере |
| Ввод в эксплуатацию | Дни до недель | Упрощенная установка, пропущенные тесты, принятый влажный трансформаторное масло | Настояйте на полном испытании и критериях масла |
| Ранний срок службы (0–5 лет) | 5 лет | Ребенческие отказы из-за качества работы; отсутствие базового DGA | Базовый DGA на 6 и 18 месяцах, отслеживание гарантии |
| Средний срок службы (5–20 лет) | 15 лет | Самодовольство; выборка растянута, тенденции упущены | Испытания на основе состояния с сигналами тревоги по скорости роста |
| Поздний срок службы (20–40 лет) | 20 лет | Необоснованное сохранение устаревших, высокопотерьных единиц | Анализ замены с учетом капитальных потерь |
| Конец срока службы | — | Неправильная утилизация масла и загрязнение участка | План утилизации с переработкой масла и восстановлением материалов |
Бюджетирование и приоритизация на уровне флота
Стратегия TCO функционирует на уровне флота, где пересекаются риск и бюджет. Практический подход следующий:
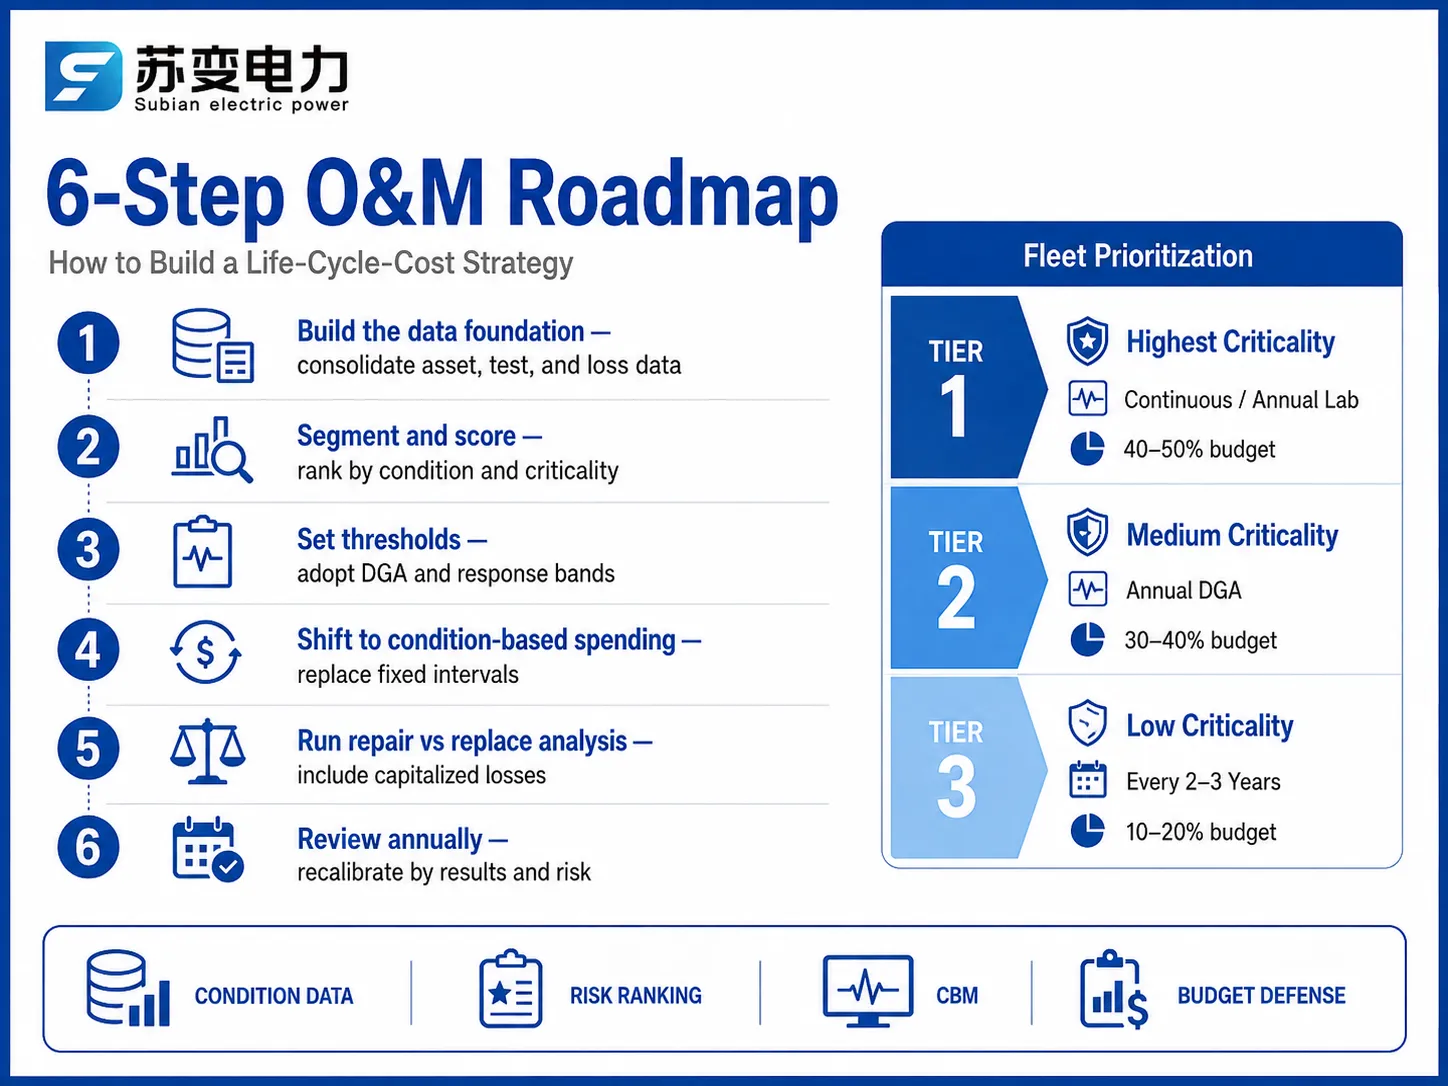
Сегментируйте флот на основе уровней критичности (влияние потерь), состояния, возраста, потерь и т.д. Рассчитайте балл состояния для каждого актива, используя DGA, анализ масла, электрические испытания, отслеживание возраста и нагрузки (ежегодно обновляемое). Ранжируйте активы на основе риска = балл состояния × критичность × последствия потерь. Распределите бюджет O&M по ранжированным позициям (например, полный мониторинг для верхнего уровня, ежегодный DGA для среднего уровня и более длительное время для низкорискового хвоста), чтобы создать очередь замен от наихудшего состояния, самых дорогих потерь в соответствии с сэкономленными затратами из бюджета на обслуживание.
Трехуровневая сегментация сохраняет бюджет пропорциональным риску:
| Уровень | Критичность | Уровень мониторинга | Частота испытаний | Доля бюджета O&M |
|---|---|---|---|---|
| 1 | Высокий (транспортировка, доход) | Онлайн-пакет | Непрерывный + ежегодный лабораторный | 40–50% |
| 2 | Средний (распределительные подстанции) | Ежегодный DGA | Ежегодно; полугодично, если аномально | 30–40% |
| 3 | Низкий (некритичный, избыточный) | Основной тест масла | Каждые 2–3 года | 10–20% |
Этот подход позволяет коммунальному предприятию защищать каждый доллар: расходы следуют за риском, а верх очереди всегда занимает единица с наихудшей комбинацией состояния и последствий.
Требования к данным для стратегии на основе TCO
Независимо от того, насколько умно нарисован дизайн, его нельзя реализовать без данных. Вот минимальная активность под трансформатором:
Идентификация актива: рейтинг, напряжения, производитель, дата ввода в эксплуатацию, серийный номер.
Потери: указанные и измеренные потери без нагрузки и при нагрузке.
История: все записи DGA, качество масла и результаты электрических испытаний, а также ремонты и события перегрузки с датами и условиями.
Профиль нагрузки: пик нагрузки, коэффициент загрузки или, по крайней мере, пик за год и поставленная энергия.
Записи о сбоях и отключениях с причинами.
Данные о стоимости: затраты на приобретение, обслуживание, отключения.
Реализация стратегии: Дорожная карта из 6 шагов
Создание базы данных: Объедините записи активов и записи испытаний в единую систему и заполните пробелы, используя первоначальную выборку в течение 12-18 месяцев.
Сегментация и расчет: Определите важность и измерьте баллы состояния для флота в целом.
Определение порогов и реакций: Используйте стандарты IEEE C57.104 / IEC 60599 для порогов измерения с различными уровнями реакции и ответственными лицами.
Переход к гибридной модели: Вместо фиксированных интервалов применяйте частоту испытаний на основе рисков.
Проведение замен: Применяйте рассчитанные потери и пересмотрите правила о том, когда ремонтировать единицы с очень высокими потерями.
Годовой анализ: Раскрытие результатов предсказанных действий по сравнению с реальными и корректировка пороговых значений.
Подводные камни затрат и как их избежать
- Акт максимизации экономии в оптимизации обслуживания: снижение времени простоя Отдела защиты трансформаторов и избежание потерь из-за его неисправности может помочь бюджету компании сэкономить около $300 в год, в то время как его…$250,000 из-за сбоя. Как я уже сказал, разрабатывайте и корректируйте действия по обслуживанию в соответствии с рисками отказов, связанными с ними.
Игнорирование интеграции потерь в процессе принятия решений: оставление старого и плохо функционирующего оборудования с высокими потерями может стоить больше в потерях, чем любые финансовые расходы, связанные с его заменой.
Ошибки в расчетах скидок или тарифов: капитализация или дисконтирование значений изменяются в соответствии с ценами на электроэнергию и ставками дисконтирования; убедитесь, что вы документируете предположения ваших расчетов и используете их для повторного выполнения расчетов и моделирования, когда тарифы необходимо корректировать.
Игнорирование последствий отключений: модели расчета затрат, исключающие потерю производства из-за неисправного оборудования и штрафы за поломки, недооценивают необходимость в ключевом оборудовании.
Отсутствие непрерывности данных: стратегия, основанная на неконтролируемых и несогласованных данных, приводит к неправильным рейтингам и необоснованным бюджетам.
Часто задаваемые вопросы
Что означает общая стоимость владения для трансформатора?
TCO — это приведенная стоимость всех затрат на протяжении срока службы актива: приобретение, потери энергии, эксплуатационные и ремонтные расходы, ожидаемые затраты на отказ и утилизацию. Для силового трансформатора потери энергии обычно составляют 50–70 процентов от TCO, что значительно превышает цену покупки, поэтому спецификация потерь и дисциплина загрузки доминируют в экономике жизненного цикла.
Как рассчитать стоимость жизненного цикла для трансформатора?
Сложите приведенную стоимость: покупка и установка; ежегодные затраты на потери (потери в холостом режиме × часы × тариф, плюс потери при нагрузке × коэффициент загрузки² × часы × тариф, дисконтированные на протяжении срока службы); ежегодные эксплуатационные и ремонтные расходы; ожидаемые затраты на отказ (вероятность отказа × последствия); и утилизацию. Используйте ставку дисконтирования 5–10 процентов и срок службы 25–40 лет.
Каков разумный ежегодный бюджет на обслуживание одного трансформатора?
Для трансформатора средней мощности полный план, основанный на состоянии, ежедневные обходы, ежегодный DGA, качество масла и электрические испытания, обходятся примерно в $1,500–$5,000 в год. Критические единицы с онлайн-мониторингом добавляют $25,000–$120,000 капитальных затрат. По сравнению с заменой стоимостью $250,000–$1.5 миллиона этот бюджет является небольшой страховкой.
Когда следует заменить трансформатор вместо его ремонта?
Замените, когда затраты на ремонт превышают 50–70 процентов от стоимости замены, когда оставшийся срок службы устройства короткий (обычно более 30–35 лет с подтвержденным старением изоляции), или когда капитализированные сбережения от потерь и меньший риск отказа нового устройства делают замену более выгодной в приведенной стоимости. Возраст сам по себе не является критерием; важны состояние и экономика потерь.
Сколько стоят потери трансформатора на протяжении срока службы актива?
Трансформатор мощностью 10 МВА, теряющий примерно 30 кВт при типичной нагрузке, обходится примерно в $20,000–$50,000 в год в виде потерь при $0.10–$0.14/kWh, что составляет $300,000–$750,000 за 20-летний период оценки в приведенных значениях, часто больше, чем цена покупки. Капитализированные значения потерь $2,000–$7,000/kW в холостом режиме и $500–$1,500/kW при нагрузке являются стандартом в оценке тендеров для коммунальных служб.
Ссылки
- IEC 60076-1: Силовые трансформаторы — Общие сведения — Стандартная основа для оценки, потерь и данных об эффективности, используемых в оценке жизненного цикла.
- IEC 60076-7: Руководство по нагрузке для масляных силовых трансформаторов — Справочная информация по загрузке, температуре и старению, которая используется в моделях затрат на потери.
- IEC 60422: Руководство по надзору и обслуживанию минеральных изоляционных масел. — Ограничения по мониторингу масла и обслуживанию, используемые в программах, основанных на состоянии.
- IEEE C57.104: Руководство по интерпретации газов, образующихся в масляных трансформаторах — Пороговые значения DGA, которые определяют оценку состояния и решения по обслуживанию.
- CIGRÉ — Технические брошюры по управлению активами трансформаторов, стоимости жизненного цикла и решениям по окончанию срока службы.
- IEEE — Опросы надежности и данные по экономике обслуживания от рабочих групп IEEE.
- Jiangsu Subian Electric Power — Производитель трансформаторов, соответствующий IEC 60076, поддерживающий конструкции с низкими потерями и закупки, ориентированные на TCO.
Заключение
План O&M для O&M трансформаторов, основанный на жизненном цикле затрат, опирается на расчеты, а не на инстинкты. Он классифицирует парк и направляет расходы на обслуживание в зависимости от состояния и важности; он оценивает ремонты/замены через капитализированные потери и разбивает бюджет каждый год в соответствии с полученными на практике результатами. Результатом является бюджет с защитой и профиль надежности с падающими расходами.
Основывайте решения на TCO.
Переходите от календарных расходов к расходам, ориентированным на состояние.
Рассматривайте замены и ремонты с точки зрения суммы капитализированных потерь.
Классифицируйте машины и ранжируйте их в соответствии с их состоянием, значимостью и последствиями.
Храните данные о состоянии на протяжении всего срока службы.
Для обновляемых парков низкопотерянные конструкции трансформаторов являются самым большим рычагом TCO. Jiangsu Subian Electric Power производит трансформаторы, соответствующие IEC 60076, до 110 кВ с уровнями потерь, подходящими для капитализированной оценки, помогая владельцам минимизировать жизненные циклы затрат. Запросите спецификацию и предложение по потерям на subian-electric.com.