


En resumen, el estudio más citado/conocido por el Departamento de Energía de EE. UU. sobre este tema concluyó que la adopción más rápida de vehículos eléctricos requerirá un poco más de inversión en las redes eléctricas locales, pero mucho menos de lo que la gente piensa, y también indicó que la utilización inteligente de la energía eléctrica puede ayudar a ahorrar 30% de esta inversión. En el estudio que abarca cinco estados, los autores estimaron aproximadamente $2.3 mil millones de costo con carga no gestionada y $1.6 mil millones con las gestionadas en gastos de distribución desde 2027 hasta 2032. Esto equivale a aproximadamente 3% de todo el dinero gastado por las empresas de servicios públicos en esos estados para distribución en el período de tiempo dado.
La investigación no es una regulación ni significa que cada una de las estaciones de carga tenga que instalar un nuevo transformador. El estudio proporciona un modelo detallado de distribución de carga eléctrica y expansión de equipos necesarios para este propósito. Este documento abarca todos los aspectos fundamentales que se deben considerar al estimar si los puntos de carga y las subestaciones necesitan actualizaciones como parte del programa de carga de vehículos eléctricos del DOE.
En cuanto a la independencia, Subian Electric es una empresa de fabricación especializada en la producción de transformadores y subestaciones. No hay conexión entre nosotros y el Departamento de Energía y todos los resultados de la investigación del DOE no pueden interpretarse como un respaldo a ninguna empresa o sus productos, incluidos los nuestros.
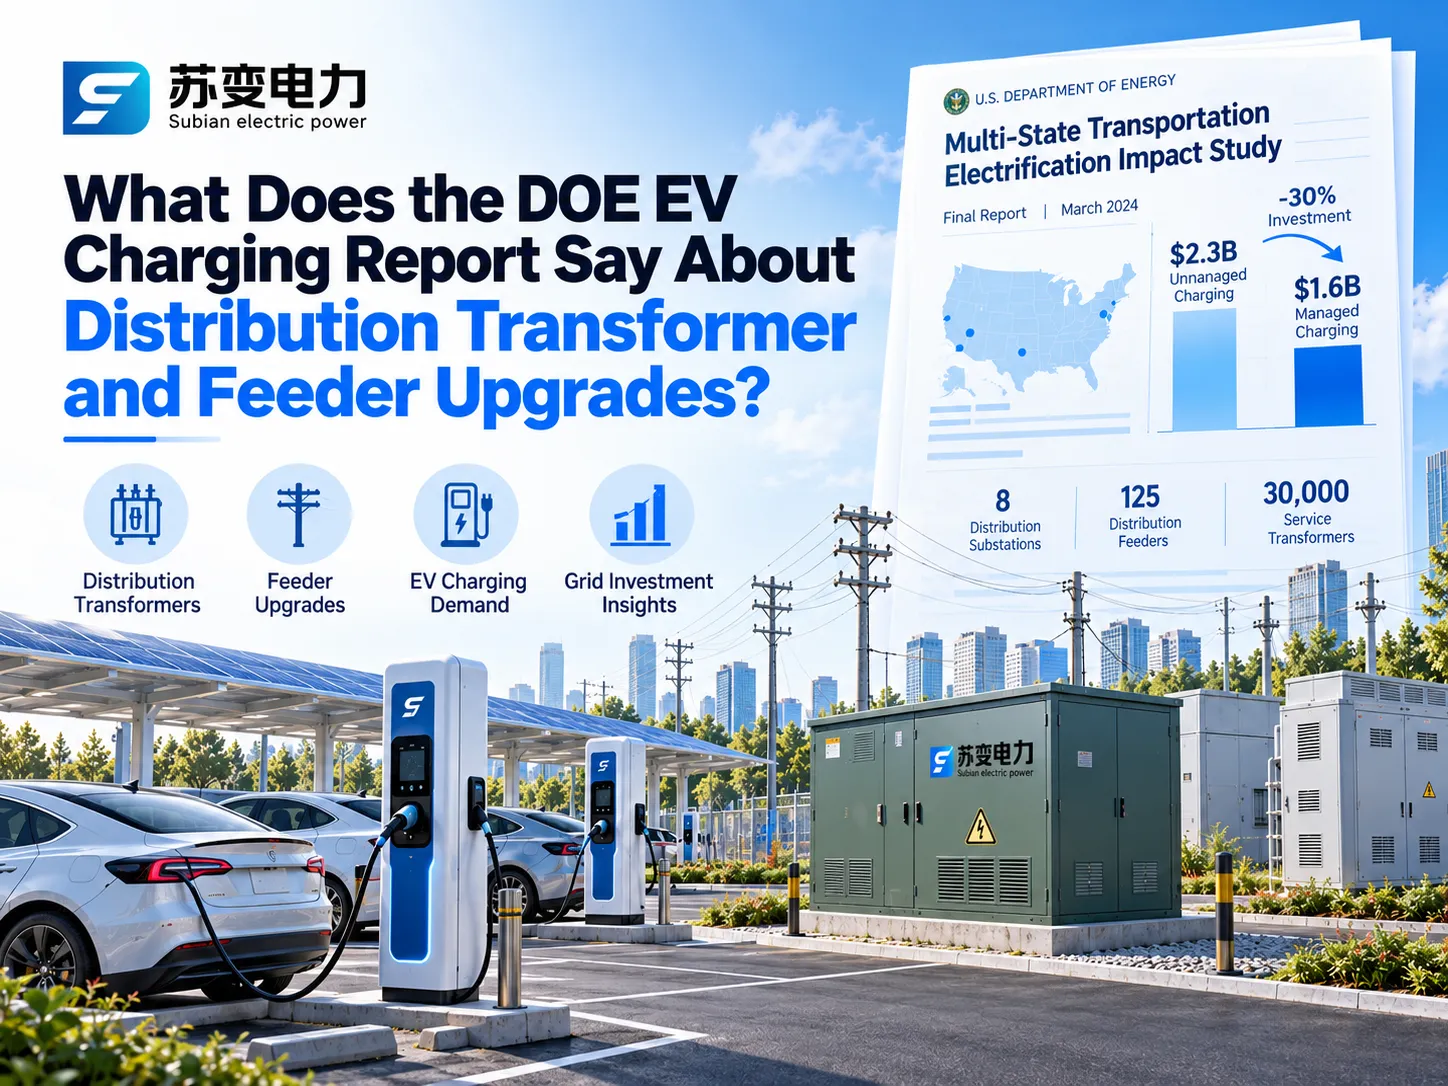
Lo que realmente encontró el Informe de Actualización de Distribución de Carga de Vehículos Eléctricos del DOE
Quién realizó el estudio y qué modeló
El informe del Estudio de Impacto de Electrificación del Transporte de Varios Estados, comúnmente abreviado como TEIS, fue publicado en el mes de marzo de 2024 y producido por el Laboratorio Nacional de Energías Renovables, el Laboratorio Nacional Lawrence Berkeley y la empresa de análisis de redes Kevala con la asistencia del DOE. Los investigadores modelaron la demanda a nivel de parcela de electricidad en las redes de distribución en California, Illinois, Nueva York, Oklahoma y Pensilvania, elegidos debido a sus diversas combinaciones de espacios urbanos y rurales, diseños de redes, tecnologías de transporte de carga y políticas relacionadas con los vehículos eléctricos.
Los autores compararon dos situaciones futuras para el año 2027 y otra situación bastante similar en el año 2032. Es decir, en el escenario de Acción, el esquema de electrificación de vehículos avanza a través de una de las opciones de cumplimiento con los requisitos federales de emisiones de vehículos considerados en 2023 para tener 55 millones de vehículos eléctricos instalados para 2032. El escenario de No Acción resulta en instalaciones menos efectivas de vehículos, es decir, 41 millones de vehículos. En los cinco estados analizados, los números totales de vehículos son 20 millones y 16 millones respectivamente, lo que implica una diferencia de 3.9 millones. Ambos escenarios se han desarrollado con tecnología de carga no gestionada, lo que significa que los vehículos reciben electricidad a plena carga justo después de ser conectados.
Los Números Principales
Todas las cifras a continuación son incrementales, lo que significa la diferencia entre los escenarios de Acción y Sin Acción, y están en dólares de 2023.
| Hallazgo | Resultado de cinco estados |
|---|---|
| Inversión incremental en la red de distribución, carga no gestionada (2027–2032) | Aproximadamente $2.3 mil millones |
| Inversión incremental en la red de distribución, carga gestionada | Aproximadamente $1.6 mil millones (30 por ciento menos) |
| Participación de la inversión anual actual en distribución en los cinco estados | Aproximadamente 3 por ciento |
| Activos de red incrementales, carga no gestionada | 8 subestaciones de distribución, 125 alimentadores y 30,000 transformadores de servicio |
| Reducción en las necesidades de activos con carga gestionada | Subestaciones aproximadamente 50 por ciento, alimentadores aproximadamente 40 por ciento, transformadores de servicio aproximadamente 30 por ciento |
| Puertos de carga incrementales necesarios para 2032 | 3 millones, de los cuales 97 por ciento son puertos de CA |
| Inversión combinada en carga y red | $12.0 mil millones, de los cuales $9.7 mil millones son equipos de carga y $2.3 mil millones son mejoras en la red |
| Beneficio neto vitalicio para el consumidor de los vehículos incrementales | $33 mil millones, más de 2.5 veces la inversión en infraestructura |
Hay dos puntos más sutiles que podrían no ser apreciados fácilmente. El primero está representado por la situación estudiada en el informe con campos de subestaciones, bancos de transformadores y transformadores de servicio finalizando las operaciones de construcción en 2027 para cerrar la brecha de demanda de 2032 y que las mejoras en los alimentadores aún están en progreso en 2032. Así, se puede ver que los alimentadores siguen siendo el problema aquí. El segundo punto importante es que el costo ha aumentado en grados similares incluso en estados muy diferentes: en el escenario no gestionado, el costo de la distribución de energía aumentará entre 3.3 y 4.3 por ciento para 2032.
Lo que el Informe No Te Dice
Es tan importante interpretar estas cifras correctamente como citarlas con precisión. La investigación se centró únicamente en subestaciones, alimentadores, transformadores y líneas de distribución. Por lo tanto, no se han tenido en cuenta los costos de generación y transmisión. Los cinco estados crean una buena comprensión pero no representan todas las circunstancias en todas las utilidades. La modelización incluyó solo la carga de hogares y depósitos de flotas, mientras que ignoró otras cargas no EV en los mismos circuitos, los autores consideran que los ahorros son conservadores. El estudio no asigna cargos de red a los usuarios de EV o a otros clientes que utilizan la misma capacidad.
Cómo Decidió el Estudio Cuándo un Transformador, Alimentador o Subestación Necesita una Mejora
La información que tiene máxima aplicación para los ingenieros en el informe se basa no en el costo que se menciona en el título, sino en la forma en que se calculó dicho costo. Kevala pudo calcular la carga máxima horaria en cada nivel de la red y definir algunas reglas claras que muestran cuándo un equipo está sobrecargado y qué se puede usar como sustituto.
| Nivel de red | Prueba de sobrecarga utilizada en el estudio | Solución modelada |
|---|---|---|
| Subestación de distribución | Carga máxima por encima del 100 por ciento de la capacidad | Agregar un banco de transformadores de 30 MW a subestaciones de menos de 100 MW, o un banco del 35 por ciento de la capacidad para las más grandes; si aún está sobrecargado, construir una nueva subestación, típicamente de 60 MW |
| Alimentador | Carga máxima superior al 100 por ciento de la capacidad térmica | Primero transfiera carga a alimentadores vecinos donde sea posible; de lo contrario, agregue un nuevo alimentador de aproximadamente 11 MW (hasta 15 kV), 24 MW (16 a 25 kV) o 30 MW (26 a 35 kV) |
| Transformadores de servicio | Pico agregado de todos los transformadores de servicio en un alimentador superior al 125 por ciento de su calificación combinada, excluyendo la carga rápida de CC | Agregue transformadores de servicio de 50 kW para cubrir la carga adicional |
| Sitios de carga rápida de CC | Cada sitio con carga rápida de CC | Un transformador de servicio trifásico dedicado dimensionado según la potencia del cargador, el número de puertos y un factor de diversidad |
El documento de investigación también detalló los costos de los componentes. Para California 2032, el costo promedio publicado para construir nuevas subestaciones fue de aproximadamente $30 millones, $10 millones para la construcción de un nuevo banco de transformadores de subestación, alrededor de $611,000 para construir un nuevo alimentador, aproximadamente $20,000 para un transformador de servicio de tipo convencional y $50,000 para un transformador de servicio dedicado a un centro de carga rápida. Aunque estos son costos esperados, dan una idea de cuán rápido están aumentando los costos. El tiempo sigue el mismo patrón. Refiriéndose a otras investigaciones, el informe indica que un proyecto de carga que dure de 3 a 10 meses puede ganar un año si debe actualizar su alimentador y hasta 4 años para una actualización de subestación.
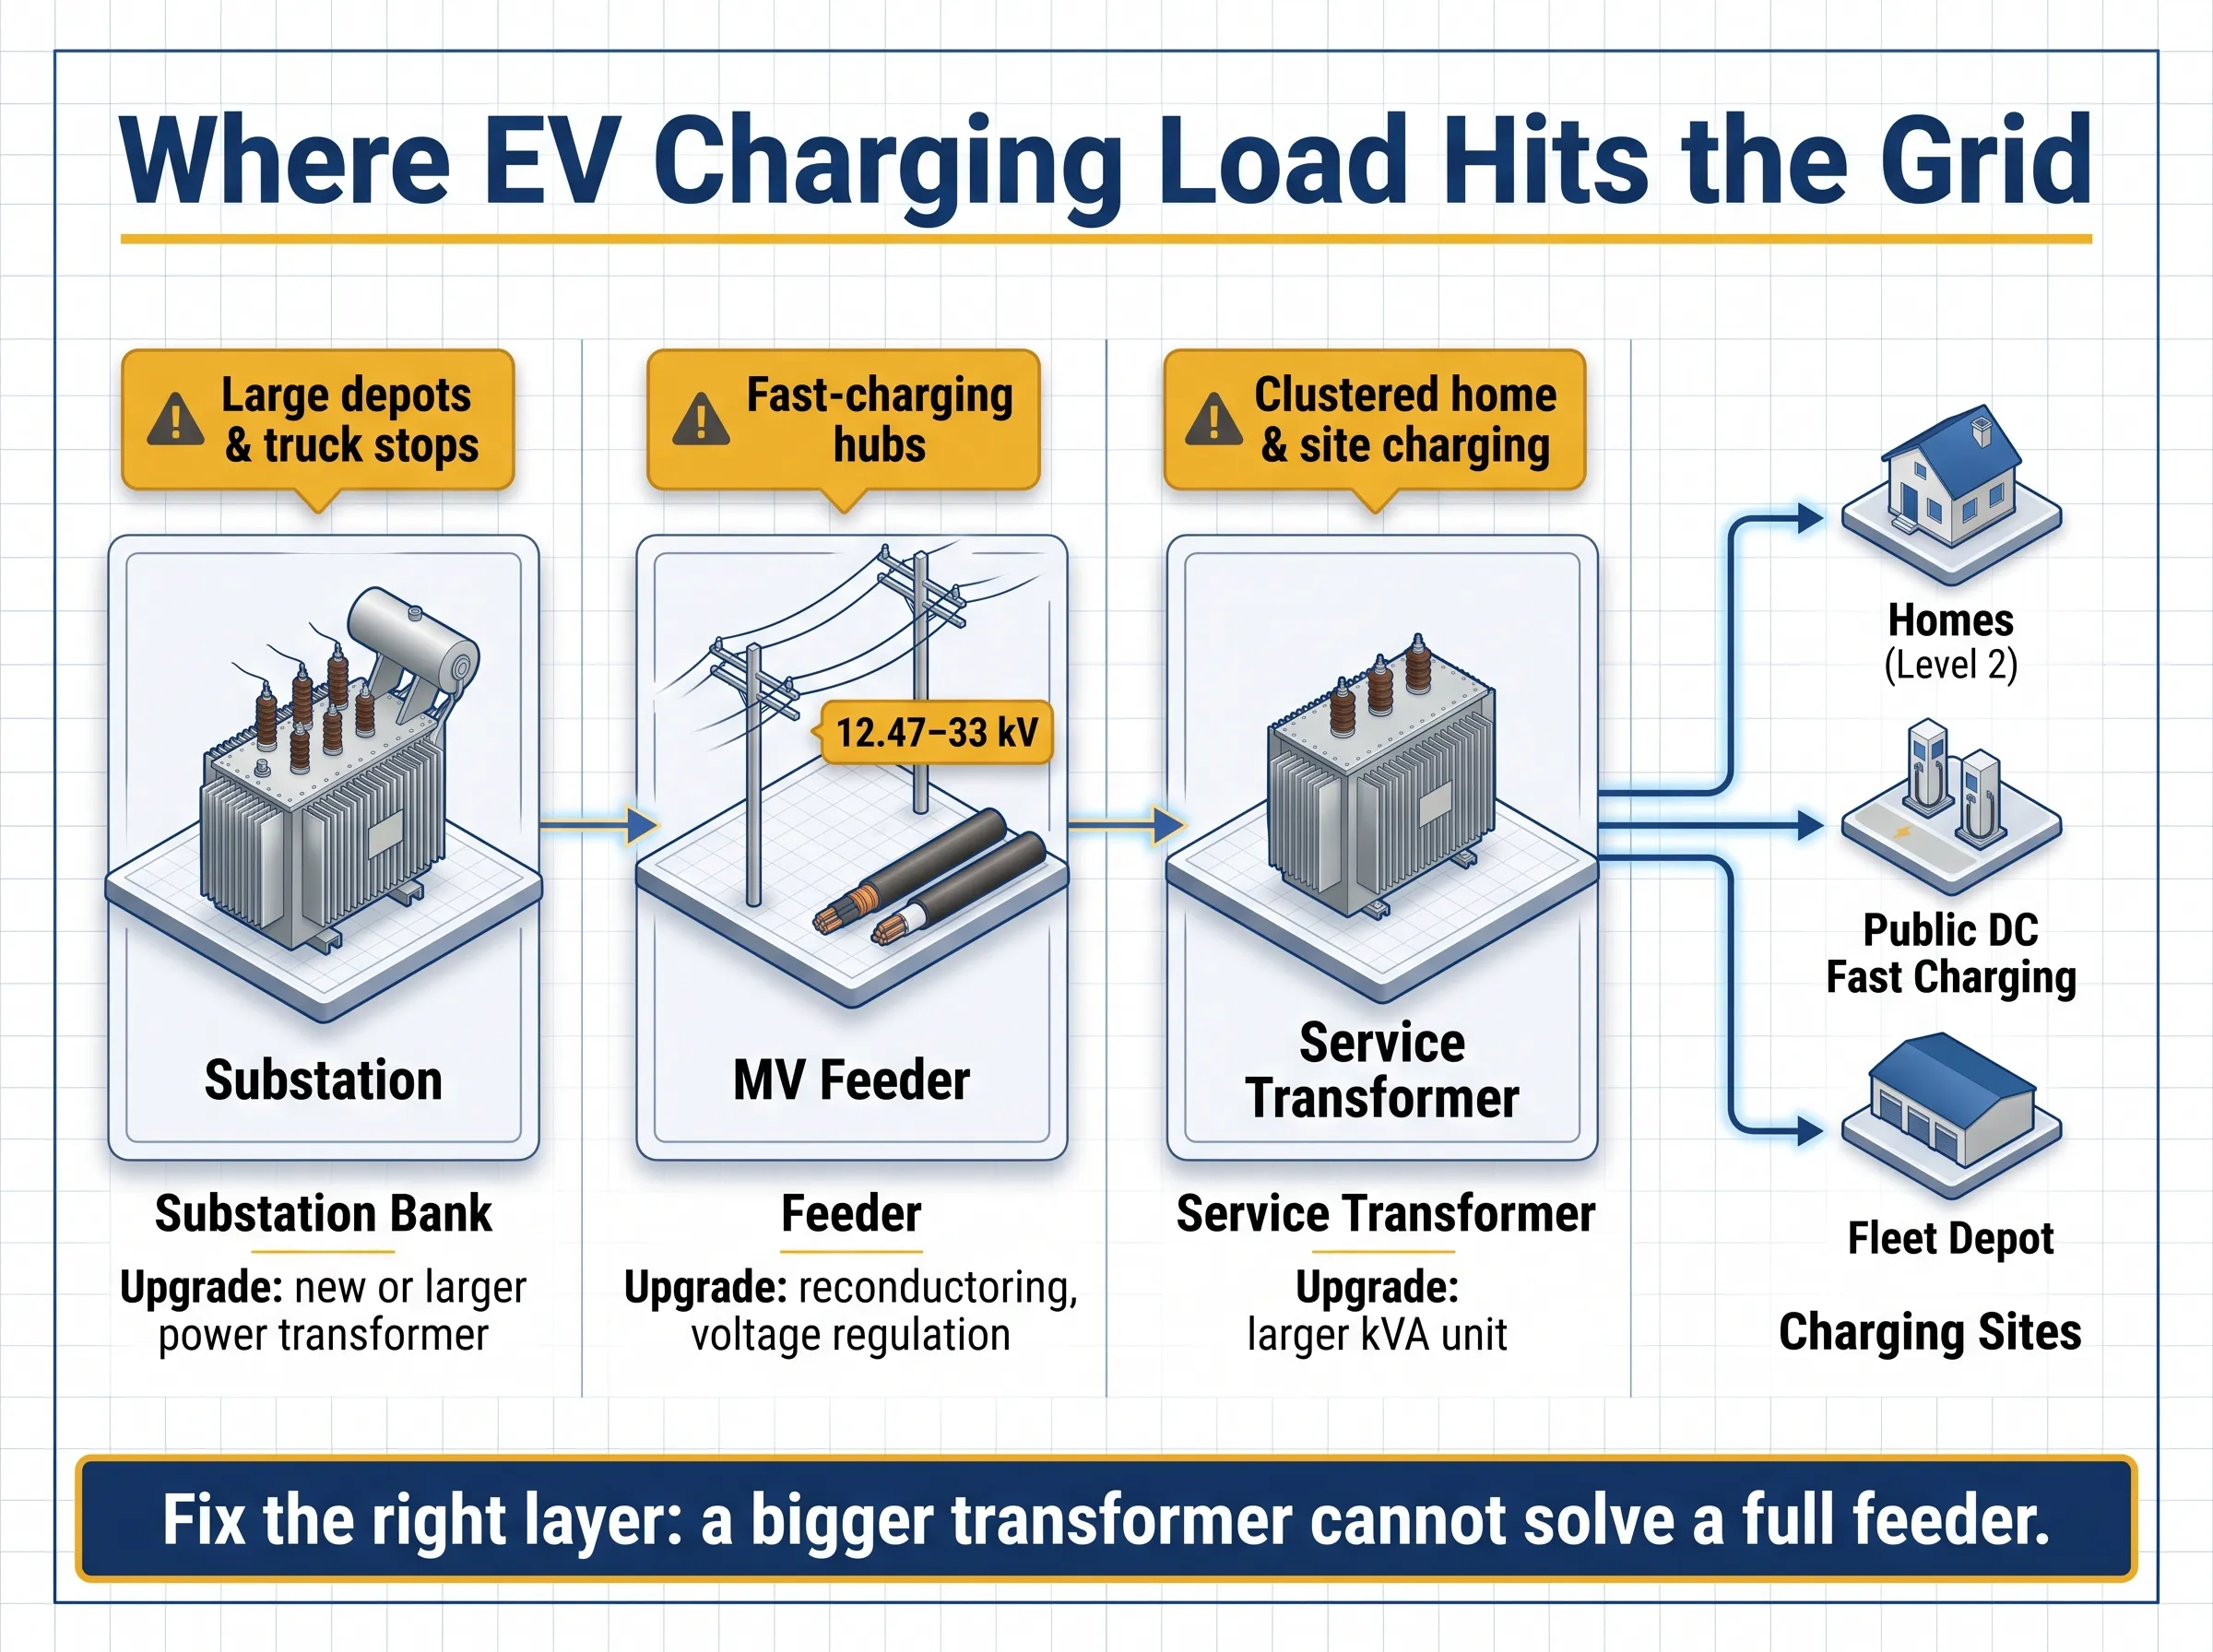
Los efectos de la carga de vehículos eléctricos en cada capa de la red de distribución eléctrica
The electrical distribution network has three distinct levels and EV charging creates different forms of disruption in each one. The most valuable information for planning purposes is to know which of these levels is the bottleneck, as responses differ for each of them.
Failures of the Service Transformer
The service transformer refers to the unit mounted at either the top of a pole or resting on the ground. Its main responsibility is to transform voltage from a medium level to a low one that can be used by customers of a given community including homes or car stations. The service transformer usually serves several customers, up to about a dozen, and hence becomes the first one to encounter the issue of clustered charging stations. The transformer is based on the need to meet the demands of all residents of a community living in homes; but this solves little in case several stations of 7-11 kW power pull the trigger at the same time.
Feeder Thermal Constraints
A feeder is the medium-rated voltage circuit which usually has 12.47 KV, 13.2 KV or 24.9 KV in North America and 10, 11, 20 or 33 KV in other countries. It can run out of capacity either when its load reaches the thermal limit or when the level of voltage on the load side changes dramatically. The triggers typically include fast charging hubs, truck depots and other places of charging where one charging station consumes more power than a whole area of residential buildings.
Substation Capacity Limitations
A substation consists of two or four transformer banks. Substation operations are the least likely to be undermined by extensive home charging; however, this is one of the most expensive and time-consuming processes of upgrades.
How EV Charging Load Differs by Site Type
The same amount of energy can be easy or hard for the grid to deliver depending on how concentrated it is and when it arrives. The TEIS appendix estimates the distribution upgrade cost attributable to each type of charger, which gives a useful sense of scale.
| Site type | Typical charger power | First pressure point | Modeled grid upgrade cost per charger, 2032, unmanaged / managed |
|---|---|---|---|
| Single-family home, Level 2 | 7 to 11 kW | Shared street transformer | About $1,500 / $1,300 |
| Workplace, Level 2 | 7 to 19 kW | Building or site transformer | About $5,000 / $5,200 |
| Public fast charging, light-duty, 150 kW | 150 kW | Dedicated site transformer, sometimes the feeder | About $29,700 / $27,400 |
| Public fast charging, light-duty, 250 kW | 250 kW | Dedicated site transformer and feeder | About $48,700 / $44,200 |
| Truck depot, 150 kW DC | 150 kW | Feeder and sometimes substation | About $47,100 / $38,000 |
| Public heavy-duty charging, 1.5 MW | 1.5 MW | Feeder and substation | About $256,600 / $187,400 |
Two notable trends emerge. The price per charger increases substantially with power, and managed charging has the highest advantage when vehicles remain parked for long periods of time, such as depots, while making almost no impact at workplaces with a steady load throughout the day. This confirms the study’s major finding that the greatest savings to the grid derive from residential spaces and fleet depots where charging can be scheduled without inconveniencing the driver.
How to Size a Distribution Transformer for DC Fast Charging
Many projects either oversize their transformer or undersize it. Oversizing occurs when the nameplate ratings for every charger are summed to calculate the size leading to wastage of capital, while ignoring losses and the coincidence of chargers sizing results in undersizing. Proper sizing of DC fast charging transformers occurs between these two extremes since it relies on clearly defined assumptions.
Charger Nameplate vs Real Grid Demand
Normally a charger will be rated for DC output. But since the grid must supply that output along with conversion losses, the AC input must be greater in value than the DC rating. In addition, not all chargers deliver their full power at any time as vehicles come at different levels of charge and charging power is reduced when the battery is filled. A lot of the sites also have a system-level limit and share power among the dispensers.
Diversity Factors Used in the DOE Study
The TEIS team sized each fast-charging site’s dedicated transformer by multiplying charger power and port count by a diversity factor that depends on charger size, vehicle class and the number of ports. For light-duty sites, the factors were:
| Charger power per port | Up to 3 ports | 4 to 8 ports | More than 8 ports |
|---|---|---|---|
| 50 kW | 1.0 | 1.0 | 1.0 |
| 150 kW | 1.0 | 1.0 | 0.5 |
| 350 kW | 1.0 | 0.75 | 0.5 |
| 500 kW | 1.0 | 0.75 | 0.5 |
It was assumed that small sites would operate at full capacity, while diversity only came into play on larger sites with high-capacity charger installations. The considerations are only assumptions in modeling, but they are a good verification tool to validate one’s own calculations. In the USA, article 625 of NEC puts EV chargers into the category of continuous loads and that affects the rating of both customer-side conductors and protective devices.
Worked Example: Eight 180 kW DC Fast Chargers
Consider a public hub with eight 180 kW DC chargers. Assume a 70 percent coincidence factor enforced by the site’s load management, 95 percent charger efficiency, a 0.98 input power factor and a 15 percent design margin for growth and auxiliary loads such as lighting, cooling and payment systems.
| Paso | Cálculo | Resultado |
|---|---|---|
| Coincident DC output | 8 × 180 kW × 0.70 | 1,008 kW |
| AC input power | 1,008 kW ÷ 0.95 | About 1,061 kW |
| Potencia aparente | 1,061 kW ÷ 0.98 | About 1,083 kVA |
| With 15 percent margin | 1,083 kVA × 1.15 | About 1,245 kVA |
| Next standard size, IEC practice | Round up | 1,250 kVA |
| Next standard size, North American three-phase pad-mount | Common ANSI ratings step from 1,000 to 1,500 kVA | 1,500 kVA |
The factor of coincidence determines the parameters of the project more than anything else. If the site is run at the loading of 50%, the value will be about 889 kVA, which would require the supply of 1,000 kVA of capacity, regardless of the system. In the case of running the site under load at 100% and without load management, the required capacity is about 1,779 kVA, which would call for 2,000 kVA. This influence is the reason why load management should be determined first, rather than done after ordering the transformer. Remember that this example is just an example, not a design – real project includes the measurement of harmonics of the chargers’ power electronics, transformer impedance, and levels of short-circuit currents, ambient temperature, and electric utility regulations.
When Is a Feeder Upgrade Needed Instead of a Bigger Transformer?
A larger transformer can be useful at a site but it will not solve issues concerning an already overloaded feeder. This is a point that often confuses people as the developer owns the transformer while the utility has the control over the feeder.
An upgrade to the electrical system for electric vehicle charging will be necessary if the following three issues occur: the new load increases the electric load that the feeder can carry; voltage levels at the end of the circuit are beyond the legal limits; or according to the utility’s hosting capacity study or interconnection study, the circuit cannot accommodate the new load without any negative effect on other consumers. As for the approach taken by the Department of Energy that pioneered the idea, the utility’s representatives focused on shifting loads to the feeder that has enough capacity before they even think about building the new circuits.
Thus, one of the lessons for developers is inescapable: work on feeders usually requires more time and costs more in comparison to switching transformers, and sometimes even means that new digging or overhead work needs to be carried out on a site. There is also an idea to get in touch with the utility in advance to check on the loading capacity before making a decision to make a purchase.
Is it Possible for Managed Charging and Battery Storage To Delay Grid Improvements?
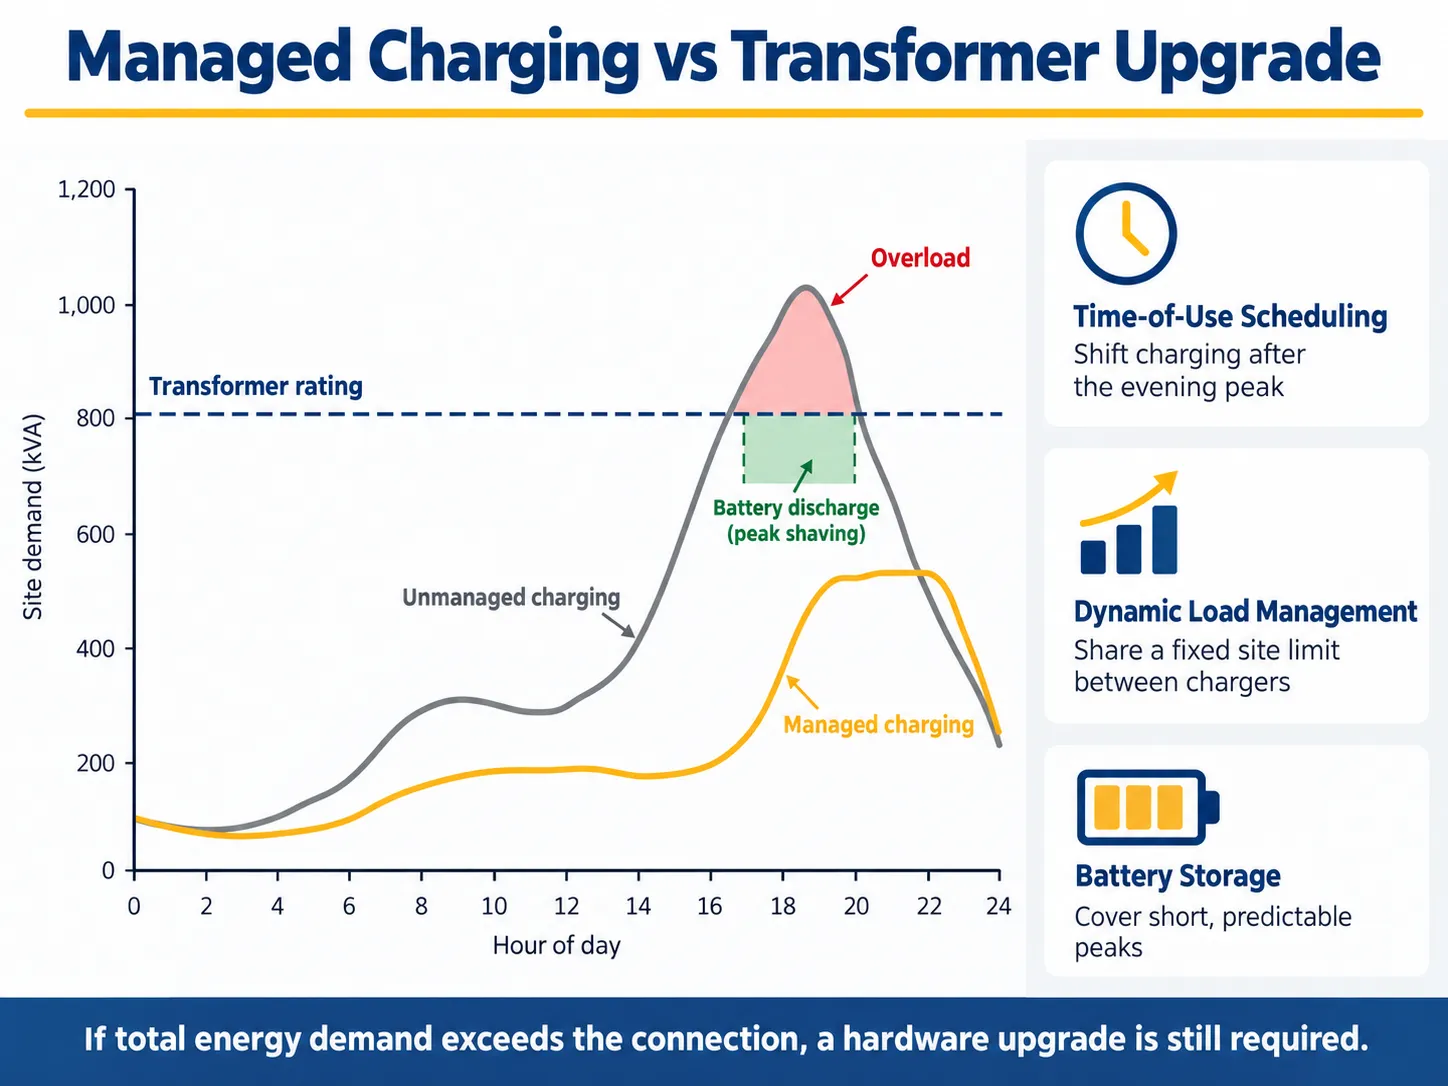
Yes, usually, and that is the main finding from the study carried out by the Department of Energy. Managed charging is meant to transfer or redistribute loads from other power sources so that existing infrastructure is able to handle the loads required. Research has indicated that managed charging can allow for a reduction in the peak electric load due to electric vehicles by about thirty percent and contribute to the need for construction of new substations, feeders, and transformers by about fifty percent, forty percent, and thirty percent respectively.
Time-of-Use Pricing and Dynamic Load Management
The most basic approach is the so-called time-of-use pricing, which means that users are incentivized to charge vehicles after the peak period in the evening. More advanced approaches allow for dynamic load management, which permits power management in real time by limiting the load in terms of performance of various charging points. In this instance, modified software can allow for effective use of transformers by distributing workload over time and limiting the total load on transformers.
Flexible Connection to the Grid
An upcoming method is the so-called flexible connection to the grid (first introduced in a paper published in 2024 by the Office of Electrical Power of the Department of Energy). This approach permits connections to charging stations before construction of facilities is completed, based on the condition that electrical charge of the facilities is reduced in fixed situations of overload. Several Californian and some northeastern states have piloted this approach and connected the electrical loading for public charging on the charging vehicle stations.
Battery Storage for Peak Shaving
A battery energy storage system is put into use at the charging station where it receives charging exposure from the grid at a slow pace when traffic is low and vice-versa where it actually discharges when activity is heavy. This enables the station to offer more power than the grid itself allows. Energy storage is useful in the locations where peak periods are short and predictable. A battery energy storage system adds its own components like a power conversion unit, devices for protection, etc. Our guide to the subestación compacta de almacenamiento de energía explains how the PCS, transformer and medium-voltage switchgear fit together in these projects.
When Hardware Upgrades Are Still Unavoidable
Management has limitations. If a facility has a set energy requirement each night, scheduling may help reduce the peak load but won’t lower the total consumption. Charging a battery is not possible if the load already exceeds the supply capacity since the battery can’t recharge. There is limited flexibility for a DC fast charging station that needs to serve any vehicles arriving at that time. Results from the US Department of Energy show that managed charging is not effective. In Oklahoma, where the demand peaks in the morning, postponing charging at night did not ease the situation. In this case, installing a well-sized transformer at the charging location or doing some work on the feeder is the only practical solution.
Choosing the Equipment: Pad-Mounted, Dry-Type or Prefabricated Substation
Pad-Mounted Transformers for Public Charging Sites
In the majority of outdoor charging locations, three-phase pad-mounted transformers are used as standard equipment. Such transformers are mounted on a concrete slab and have a protected enclosure so they can be put near the charging points. Important settings for selection include input voltage, loop or radial power supply, connection configuration, resistance, and effectiveness. Subian Electric manufactures three-phase pad-mounted transformers configured to each project’s network voltage and standard.
Dry-Type Transformers for Indoor and Parking Structures
In instances where invigilators are installed within the underground parking areas, underground garages, or buildings, the fire safety regulations would generally prefer isolation transformers. Hence, the most common option would be cast resin dry type transformers that do not need an oil tank at all and need minimal servicing. Subian’s transformadores de tipo seco includes epoxy-resin cast units for these installations.
Prefabricated Substations for Large Charging Hubs
Medium-voltage switchgear, one or several transformers and a low-voltage board are usually required at large hubs and bus stations where charging is combined with solar and storage. A prefabricated substation manufactured in a plant provides everything in one tested enclosure and saves a lot of time when working on the site.Our compact substation guide covers how these units are specified. Subian’s subestación prefabricada serie YB integrates the three sections in one unit, and for 33 kV networks the company also builds 33 kV compact substations.
IEEE C57 vs IEC 60076 and IEC 62271-202
The two main families of standards should not be mixed, because voltages, ratings and test levels differ.
| Artículo | North American utility projects | International projects |
|---|---|---|
| Estándar de transformadores | IEEE C57 series, including IEEE C57.12.34 for three-phase pad-mounted units | Serie IEC 60076 |
| Prefabricated substation standard | Utility and customer specifications | IEC 62271-202 |
| Typical distribution voltages | 12.47, 13.2, 24.9 and 34.5 kV | 10, 11, 20, 22 and 33 kV |
| Frecuencia | 60 Hz | 50 Hz in most markets, 60 Hz in some |
| Common three-phase ratings around 1 MVA | 750, 1,000, 1,500 kVA | 800, 1,000, 1,250, 1,600 kVA |
| Approval route | Utility specification and approved vendor list | Type test reports and utility or consultant approval |
Subian Electric builds mainly to IEC standards for projects in Asia, Africa, the Middle East and Latin America. North American requirements can be engineered on a project basis, but voltage, insulation level, configuration and utility acceptance must be confirmed at the start of every enquiry.
What Drives Upgrade Costs and Lead Times?
There is a huge variation in implementation costs of charging sites, from very low in cases of present spare capacity to many millions if the expansion of a substation is required. Major factors in the overall costs of charging site implementation are transformer and switchgear itself; installation costs incurred, which usually exceed hardware costs; costs related to utility make-ready and interconnection; and completion of various reinforcement works. It is important to note that the charging cost estimations are based on TEIS documents, which do not take into account utility-side improvements or on-site storage, which is significant, according to the authors.
The person who pays the bill depends on the ownership boundary. Utility practices vary: the utility bears the costs and owns the equipment before the revenue meter (with transformer sometimes included), while the developer pays for everything behind it in some cases. In some other cases, customer is making the purchase of the needed transformer himself. The earlier the boundaries of the costs responsible for the parties at the project are checked, the fewer chances for budget surprises.
Nowadays, time matters as much as money. Demand growing from sources of renewables, data centers, and electrification can lead to expansion of transformers’ lead time in different markets. Therefore, if a project is waiting for the permits to start the process of equipment ordering, it may wait for a considerable period of time. Hence, it is better to choose standard ratings, to make sure the specifications check is done, and to involve more than one qualified manufacturer.
EV Charging Distribution Transformer RFQ Checklist
Whether you are buying a single pad-mounted unit or a complete substation, sending the same clear brief to every supplier makes quotations comparable.
| Categoría | What to specify |
|---|---|
| Clasificaciones | Primary and secondary voltage, frequency, rated kVA with the load calculation and coincidence assumption behind it |
| Electrical design | Vector group, impedance, basic insulation level, tap range, harmonic loading from chargers |
| Configuración | Loop or radial feed, dead-front or live-front, primary protection, LV outgoing feeders |
| Efficiency and construction | Loss limits under local regulations, insulating fluid or dry-type construction |
| Site conditions | Ambient temperature, altitude, corrosion and flood risk, enclosure protection |
| Standards and documents | IEEE C57 or IEC 60076, routine test reports, type test evidence, drawings |
| Comercial | Delivery time, packing, warranty, commissioning support |
Preguntas Frecuentes
What does the DOE EV charging distribution transformer and feeder upgrades report say?
The Multi-State Transportation Electrification Impact Study published in 2024 projected that an additional $2.3 billion distribution investment was required across five states from the year 2027 to the year 2032 with the adoption of unmanaged charging that included 8 substations, 125 feeders and 30,000 service transformers. The amount required to invest in the distribution with managed charging decreased to around $1.6 billion.
Does EV charging always require a transformer upgrade?
No. In most cases, the connections to the home and small sites remain the same. Upgrades may occur where multiple chargers share a single service transformer, where a site implements high-power DC fast charging, or where a fleet depot has numerous vehicles in one location.
What size transformer does a DC fast charging station need?
Charging capacity is determined by the number of chargers, coincidence factor, efficiency as well as power factor. In the example mentioned above, eight 180 kW chargers which have a coincidence of 70 percent require about 1,245 kVA, which amounts to 1,250 kVA as per IEC standard and 1,500 kVA according to standard North American specifications.
Can managed charging avoid a feeder upgrade?
There are times when it happens. The research conducted by DOE proved the reduction of the feeder requirements by approximately 40 percent. Changing or limiting loads helps contain peaks of the load within the feeder’s limits. With versatile connections, some installations can connect before the upgrade is finished, however, an installation with energy demand exceeding the level must be upgraded.
Can battery storage replace a transformer upgrade?
Battery storage can cover short, predictable peaks and let a site deliver more charging power than its connection allows. It cannot replace an upgrade when the site’s average load is already close to or above its grid connection.
Are DOE transformer efficiency standards the same topic?
No. The TEIS document is a grid planning report. The Department of Energy is responsible for the implementation of minimum efficiency standards for distribution transformers sold in the United States through rules issued in 2024 to come into force in 2029. Each is relevant to buyers, however, they are not the same.
Referencias
- U.S. Department of Energy: Multi-State Transportation Electrification Impact Study (2024)
- National Renewable Energy Laboratory: Transportation Electrification Impact Study results
- U.S. Department of Energy Office of Electricity: Flexible DER and EV Connections (2024)
- Alternative Fuels Data Center: Procurement and Installation for EV Charging Infrastructure
- Transformador de distribución, Wikipedia
The DOE research makes one point clear: grids can support large-scale EV charging, provided the right equipment is planned in the right place and load is managed sensibly. When your charging hub, fleet depot or parking project needs a transformer or substation, Jiangsu Subian Electric Power Equipment Co., Ltd. designs and builds pad-mounted and dry-type transformers, prefabricated substations and new energy substations for charging and storage projects, configured to your network voltage and standard. For private-label or distributor supply, see our programa OEM y ODM. Send your charger list, network voltage and site conditions through our página de contacto, and our engineers will reply with a sizing check, drawings and a factory quotation.