


يقوم مدير الأصول حاليًا بتقييم ميزانية التشغيل والصيانة لأسطول المحولات الذي يتكون من 400 محول، والتي تحتاج إلى تقليص بنسبة 15 في المئة وفقًا لتوجيهات مجلس الإدارة. ومع ذلك، فإن الهدف لن يكون سهلاً، حيث لا توجد تغييرات يجب إجراؤها على أهداف الموثوقية. يميل البعض إلى تقليل أخذ عينات الزيت، وتجاوز بعض عمليات الصيانة، وإجراء بعض التحركات المماثلة باسم إدارة الميزانية الاقتصادية؛ ومع ذلك، فإن مدير الأصول على دراية من تجربته كيف تسير الأمور بشكل مختلف على المدى الطويل - حيث يتم ترجمة المكاسب المجمعة من الصيانة بسرعة إلى خسائر مقابلة، والتي ستظهر بعد ثلاث إلى خمس سنوات، عندما ستكلف الاستبدالات الطارئة مدير الأصول أكثر من المبلغ المدخر. البديل هو إدخال استراتيجية صيانة دورة الحياة، التي تأخذ في الاعتبار التكاليف الإجمالية لكل إجراء صيانة لمدة 30-40 سنة من عمر المعدات.
سيساعدك دليلنا على التعرف على كيفية تصميم وتنفيذ استراتيجية التشغيل والصيانة، والتي ستؤدي إلى أقل تكلفة إجمالية للملكية لأسطول من المحولات. ستتعلم كيفية تنظيم حساب التكلفة الإجمالية للملكية، وتطبيق بيانات الفشل وبيانات الحالة من أجل تركيز الإنفاق على إجراءات الصيانة التي ستجلب أعلى المكاسب على مدى عمر المعدات.
إطار العمل للتكلفة الإجمالية للملكية
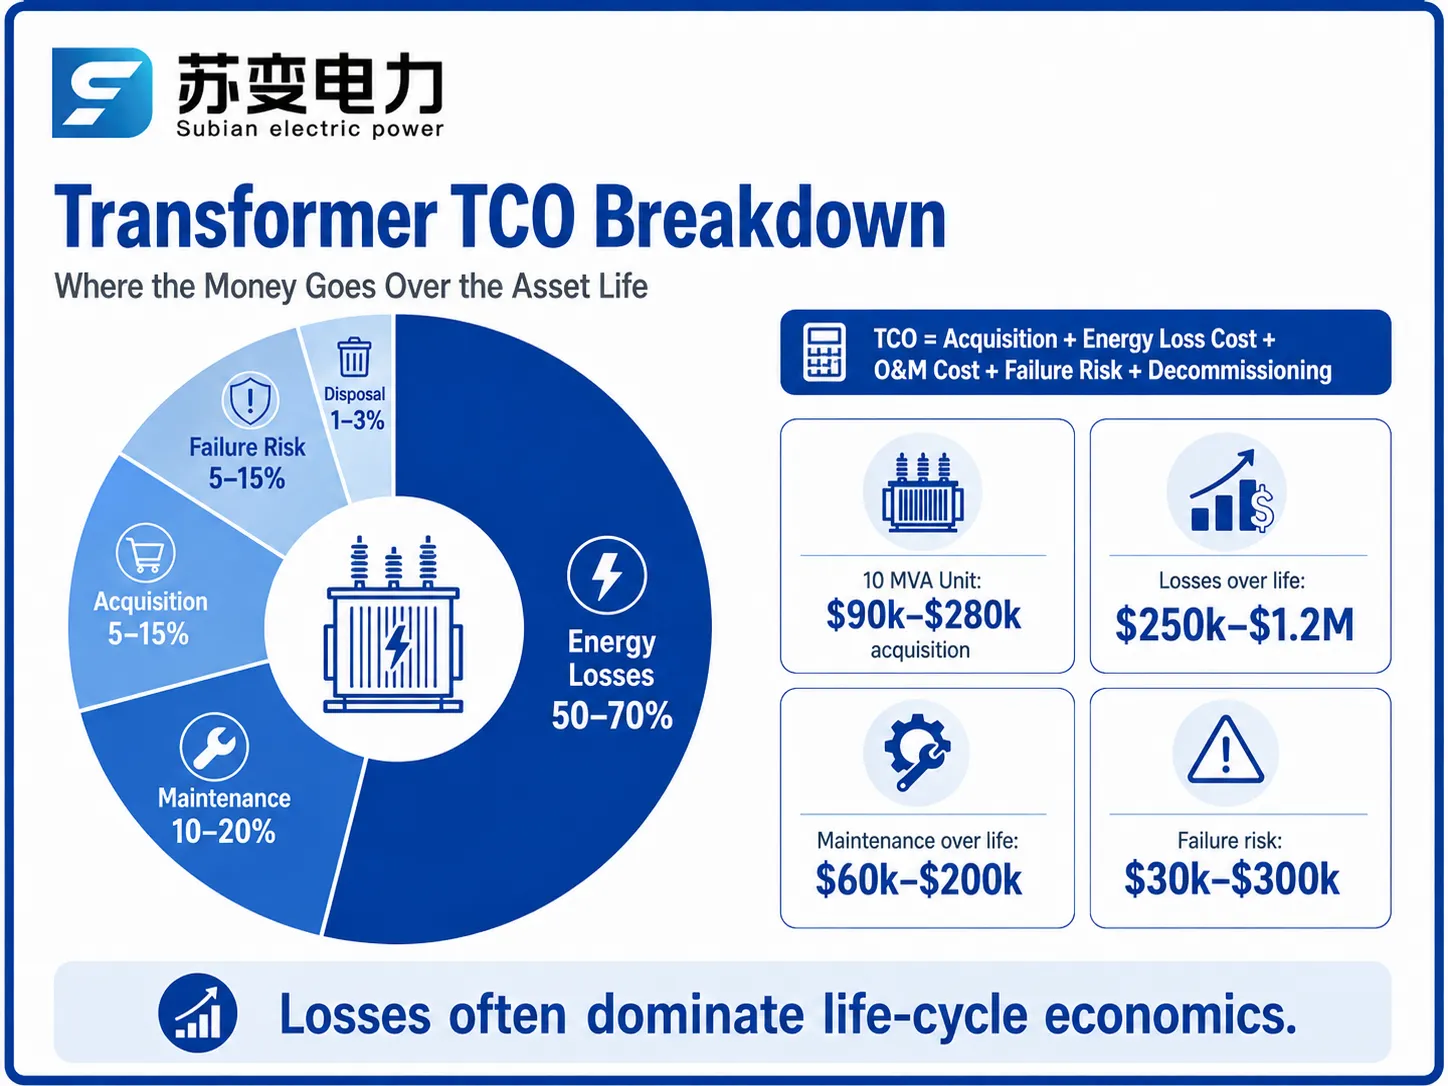
تشير تكلفة دورة الحياة، المعروفة أيضًا بالتكلفة الإجمالية للملكية، إلى التكاليف الإجمالية التي تتحملها قطعة من المعدات بدءًا من وقت شرائها حتى وقت التخلص منها. في حالة المحولات، يتم التعبير عن صيغة التكلفة الإجمالية للملكية بالطريقة التالية:
التكلفة الإجمالية للملكية = تكلفة الاستحواذ + تكلفة فقد الطاقة + تكلفة التشغيل والصيانة + تكلفة مخاطر الفشل + تكلفة إلغاء الخدمة
لكل من هذه المتغيرات خصائصها الخاصة. تكلفة الاستحواذ هي من نوع لمرة واحدة. يتم حساب تكلفة فقد الطاقة من حيث القيم الحالية للخسائر التي تكبدها الأصل خلال فترات تشغيله. المتغيرات الأخرى هي كما يلي: تكاليف التشغيل والصيانة هي الرسوم التي تتحملها للصيانة السنوية المنتظمة للمحولات، بينما تكلفة مخاطر الفشل هي التكلفة المتوقعة التي تتحمل نتيجة لفشل المحول. تشير تكلفة الإلغاء إلى التخلص من الزيت وتفكيك المحول والخزان.
الاستنتاج الرئيسي المستخلص من مقارنة هذه التكاليف هو أن قيم هذه التكاليف تختلف بشكل كبير عن تلك المتوقعة. في حالة المحول الكهربائي النموذجي، تبلغ تكلفة فقد الطاقة خلال فترة 30 عامًا ما يعادل 2-5 مرات أعلى من سعر الاستحواذ الأصلي، بينما قد تكون تكاليف مخاطر الفشل مساوية أو أعلى من سعر الاستحواذ. لذلك، فإن أي نهج يركز على تحسين سعر الاستحواذ أو تكاليف الصيانة فقط يعتبر غير مناسب.
أين تذهب الأموال: تحليل التكلفة الإجمالية للملكية حسب المكون
توفر تحليلات دورة الحياة المنشورة وعمليات المرافق معلومات متسقة حول أين يتم إنفاق أموال المحولات. يختلف التفصيل الدقيق وفقًا للطاقة المقدرة، والخسارة، وتعريفات الكهرباء، ومعدلات الخصم، ولكن يمكن اعتبار النمط التالي تمثيليًا لمحولات متوسطة.
| مكون التكلفة | الحصة النموذجية من TCO | النطاق المطلق النموذجي (وحدة 10 MVA) | قابل للتحكم؟ |
|---|---|---|---|
| الاستحواذ (الشراء + التركيب) | 5–15% | $90,000–$280,000 | عند الشراء؛ يشمل تعويضات الخسارة |
| خسائر الطاقة (القيمة الحالية، 30 سنة) | 50–70% | $250,000–$1.2 مليون | نعم: مواصفات الخسارة، انضباط التحميل |
| الصيانة (روتينية + دورية) | 10–20% | $60,000–$200,000 على مدى الحياة | نعم: استهداف قائم على الحالة |
| خطر الفشل (القيمة المتوقعة) | 5–15% | $30,000–$300,000 | نعم: المراقبة، الحماية، الإصلاحات |
| إيقاف التشغيل والتخلص | 1–3% | $10,000–$50,000 | جزئيًا: إدارة الزيت والنفايات |
الخلاصة هي أن الخسائر تسود. فرق 10 كيلو واط في خسارة عدم التحميل يترجم إلى قيمة $30,000 بناءً على $3,000 لكل كيلو واط بالدولار اليوم، وهو مبلغ يعادل عدة سنوات من نفقات الصيانة. لذلك، يعتبر النهج الموجه نحو TCO أن مواصفات الخسارة والتحميل متساوية في الأهمية مع أنشطة الصيانة.
خيارات استراتيجية O&M: تفاعلية، وقائية، تنبؤية، RCM
توجد استراتيجيات O&M على طيف، ولكل منها ملف تكلفة:
| الاستراتيجية | النهج | تكلفة O&M النسبية | خطر الفشل | الأفضل لـ |
|---|---|---|---|---|
| تفاعلية (تشغيل حتى الفشل) | الإصلاح فقط عند الفشل | أقل صيانة، أعلى تكلفة فشل | عالي | وحدات منخفضة الأهمية، رخيصة، قابلة للاستبدال |
| وقائية (مبنية على التقويم) | اختبارات وإصلاحات بفواصل ثابتة | متوسطة؛ مضيعة على الوحدات الصحية | متوسط | أساطيل قديمة بدون بيانات حالة |
| تنبؤية (مبنية على الحالة) | اختبارات وإجراءات مدفوعة بالحالة | متوسطة؛ إنفاق مستهدف | أقل | وحدات متوسطة وحساسة مع برامج DGA |
| مركزية موثوقية (RCM) | تحليل وضع الفشل لكل وحدة | محسّنة؛ أعلى جهد هندسي | الأدنى | أصول نقل حرجة |
تجد الغالبية العظمى من الأساطيل أن النهج الهجين لـ TCO هو الأكثر فعالية، حيث يتم الحفاظ على الجزء الأكبر من الوحدات من خلال الصيانة التنبؤية/القائمة على الحالة بينما تناسب الصيانة التفاعلية فقط الوحدات ذات القيمة المنخفضة، ويتم تنفيذ منهجية RCM في عدد قليل من الوحدات الاستثنائية حيث ستكون الخسارة مدمرة. تكمن قوة هذا النهج في التجزئة، بدلاً من نهج واحد يناسب الجميع في التطبيق.
الصيانة المعتمدة على الحالة في الممارسة العملية
الصيانة المعتمدة على الحالة (CBM) هي مبدأ نظام صيانة قائم على التكلفة الإجمالية للملكية لأنها تهدف إلى الاستثمار في الصيانة فقط في المجالات التي يوجد فيها تآكل. التقنيات المستخدمة في الممارسة مع قيم تكلفتها:
– تحليل الغاز المذاب (DGA) وفقًا لمعيار IEEE C57.104/IEC 60599 هو حوالي $200-500 لكل عينة. يتم أخذ العينات مرة واحدة في السنة كخط أساس وأكثر تكرارًا إذا كانت هناك أي زيادات في قيمة الغاز. هذا هو الاختبار الأكثر قيمة المحسوب من حيث المال المنفق.
– اختبارات جودة الزيت: جهد الانهيار، الرطوبة، اختبار الحموضة توفر حزمة من الخدمات بتكلفة $150-400، مما يوفر اكتشاف التلوث قبل أن يؤدي إلى فشل العزل.
– الاختبارات الكهربائية: مقاومة العزل، النسبة، اختبارات مقاومة اللف بتكلفة $300-1500 لكل وحدة لكل دورة تساعد في اكتشاف تدهور اللف والعزل.
– اختبارات التفريغ الجزئي كما في حالة الوحدات الحرجة أو إذا أظهر تحليل الغاز المذاب أن أي نشاط تفريغ يحدث، تكلف بين $1500 و $8000 لكل وحدة.
– المراقبة عبر الإنترنت بتكلفة تتراوح بين $25000 و $120000 لكل وحدة حرجة تنطبق في تلك الحالات عندما تبرر تكلفة توقف الصيانة النفقات.
معنى قاعدة CBM واضح جدًا: يجب على المرء أن ينفق الحد الأدنى من المبلغ المطلوب للاختبار للحفاظ على مستوى عدم اليقين حول حالة الوحدة مقبولًا ثم استخدام البيانات لاتخاذ الإجراءات. نتيجة استخدام CBM عبر جميع المعدات عادة ما تكون انخفاض تكاليف الصيانة الإجمالية بنسبة 15-30% مقارنة بالصيانة الوقائية وتقليل فترات التوقف.
قواعد القرار الاقتصادي: الإصلاح، التقاعد، أو الاستبدال
جميع الاكتشافات المهمة تتطلب نفس السؤال الاقتصادي: هل يجب إصلاح، التوقف، أو استبدال عمل كائن ما. يجب اتخاذ قرار بشأن ما إذا كانت البدائل أرخص على مدار دورة حياتها بالكامل.
احسب التكاليف لكل خيار ممكن بالقيمة الحالية: سعر الإصلاح وتكلفة الصيانة ومخاطر الفشل على مدى عمره المتبقي؛ تكلفة الاستبدال (معدات جديدة وخسائر إضافية وصيانة) أقل من سعر الخردة للمعدات القديمة.
حدد الخسائر إلى $2,000–$7,000/ك.و طاقة غير محملة و $500–$1,500/ك.و محملة. قد تكلف وحدة قديمة ذات خسائر عالية عادةً أكثر في التشغيل من الاستبدال حتى لو كانت لا تزال تعمل لأن تكلفة الخسارة أعلى من تكلفة الاستبدال.
طبق قاعدة 50–70%: إذا كانت تكاليف الإصلاح أكثر من 50–70% من تكاليف الاستبدال، أو إذا كان الإصلاح ينطوي على مخاطر عالية من الفشل اللاحق، فمن الأفضل استبدال المعدات القديمة.
ضع في اعتبارك أن العمر المتبقي عامل مهم: المعدات التي تم صيانتها لمدة 10 سنوات عادةً ما يتم إصلاحها؛ جهاز عمره 35 عامًا مع شيخوخة موثقة بشكل صحيح سيتم استبداله تقليديًا حتى لو كانت تكلفة الإصلاح أقل اليوم.
ضع في اعتبارك قيمة التوقف من أجل الأهمية: بالنسبة للوحدات الحرجة، قد تكون تكاليف الاستبدال مبررة على افتراض أن الوحدة الجديدة لديها فرصة فشل أقل حتى لو كانت الحسابات لا تزال متوازنة.
يجب أن نلاحظ أن تطبيق هذه القواعد من قبل شركات المرافق يظهر أن ما يسمى بالتقاعد المبكر للوحدات القديمة ذات الخسائر العالية هو، في الواقع، أفضل حل من حيث التكلفة الإجمالية للملكية، حيث تغطي مدخرات خسائر الوحدة الجديدة معظم تكاليف الاستبدال. مثال يعتمد على مقارنة مبسطة بقدرة 10 MVA لمدة 25 عامًا موضح أدناه.
| العنصر (وحدة 10 MVA، أفق 25 عامًا) | الاحتفاظ بالوحدة القديمة | الاستبدال بوحدة جديدة |
|---|---|---|
| فقدان بدون تحميل | 25 كيلو واط | 12 كيلو واط |
| قيمة الخسارة المرسملة ($3,000/كيلو واط) | $75,000 | $36,000 |
| الصيانة السنوية | $8,000، في تزايد | $3,000 |
| رأس المال للاستبدال | — | $150,000 |
| خطر الفشل | في تزايد، 2–5%/سنة | 5–1%/سنة |
دورة حياة المحول والفخاخ التكلفة في كل مرحلة
كل مرحلة من دورة حياة المحول لها فخ التكلفة الخاص بها:
| المرحلة | المدة النموذجية | فخ التكلفة الرئيسي | تدابير مضادة قائمة على التكلفة الإجمالية للملكية |
|---|---|---|---|
| الشراء | 3–9 أشهر | الشراء بناءً على السعر فقط؛ الوحدات ذات الخسائر العالية تقيد عقود التكلفة لعقود | تقييم الخسائر المرسملة في المناقصة |
| بدء التشغيل | أيام إلى أسابيع | التركيب المتسرع، تخطي الاختبارات، قبول الزيت الرطب | الإصرار على اختبارات التشغيل الكاملة ومعايير الزيت |
| الحياة المبكرة (0–5 سنوات) | 5 سنوات | فشل مبكر بسبب جودة العمل؛ لا يوجد DGA أساسي | DGA الأساسي في الشهرين 6 و18، تتبع الضمان |
| منتصف العمر (5–20 سنة) | 15 سنة | الرضا؛ أخذ العينات ممتد، الاتجاهات مفقودة | اختبار قائم على الحالة مع إنذارات معدل الزيادة |
| الحياة المتأخرة (20–40 سنة) | 20 سنة | الحفاظ غير المبرر على الوحدات القديمة ذات الخسائر العالية | تحليل الاستبدال مع الخسائر المرسملة |
| نهاية العمر | — | التخلص غير السليم من الزيت وتلوث الموقع | خطط للتخلص مع إعادة تدوير الزيت واستعادة المواد |
ميزانية وتحديد أولويات على مستوى الأسطول
تعمل استراتيجية TCO على مستوى الأسطول، حيث يتقاطع المخاطر والميزانية. النهج العملي هو كما يلي:
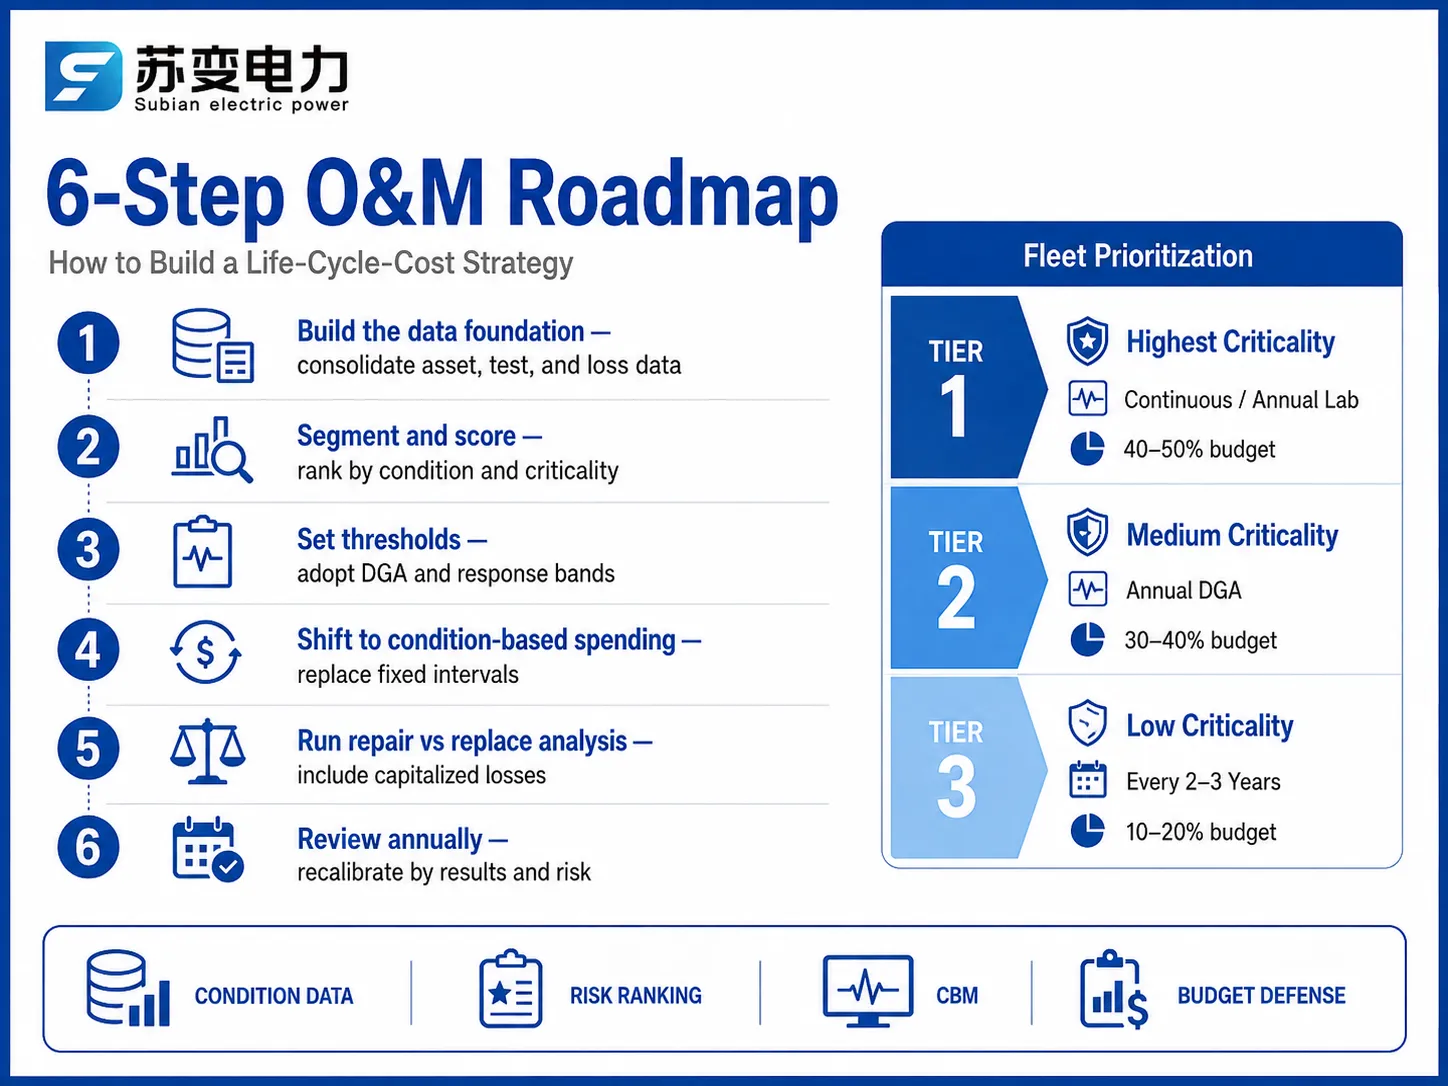
قسم الأسطول بناءً على مستويات الأهمية (أثر الخسارة)، الحالة، العمر، الخسارة، إلخ. احسب درجة الحالة لكل أصل باستخدام DGA، تحليل الزيت، الاختبارات الكهربائية، العمر وتتبع الحمل (يتم تحديثه سنويًا). رتب الأصول بناءً على المخاطر = درجة الحالة × الأهمية × عواقب الخسارة. وزع ميزانية O&M على المواقع المرتبة (مثل: المراقبة الكاملة للدرجة العليا، DGA سنويًا للدرجة المتوسطة ووقت أطول للذيل منخفض المخاطر) لإنشاء قائمة استبدالات من أسوأ حالة، أغلى الخسائر وفقًا للتكاليف المدخرة من ميزانية الصيانة
يحافظ تقسيم ثلاثي المستويات على تناسب الميزانية مع المخاطر:
| اللائحة هي | الأهمية | مستوى المراقبة | تكرار الاختبار | حصة ميزانية O&M |
|---|---|---|---|---|
| 1 | الأعلى (النقل، الإيرادات) | مجموعة عبر الإنترنت | مستمر + مختبر سنوي | 40–50% |
| 2 | المتوسط (محطات توزيع) | DGA سنوي | سنوي؛ نصف سنوي إذا كان غير طبيعي | 30–40% |
| 3 | المنخفض (غير حرج، زائد) | اختبار زيت أساسي | كل 2-3 سنوات | 10–20% |
يتيح هذا النهج للمرافق الدفاع عن كل دولار: تتبع النفقات المخاطر، وأعلى القائمة دائمًا هو الوحدة ذات أسوأ مزيج من الحالة والعواقب.
متطلبات البيانات لاستراتيجية قائمة على TCO
بغض النظر عن مدى ذكاء التصميم المرسوم، لا يمكن تنفيذه بدون بيانات. إليك الحد الأدنى من الأنشطة تحت المحول:
هوية الأصل: التصنيف، الفولتية، الشركة المصنعة، تاريخ التشغيل، الرقم التسلسلي.
الخسائر: الخسائر المحددة والمقاسة بدون تحميل وخسائر التحميل.
التاريخ: جميع سجلات DGA، جودة الزيت، ونتائج الاختبارات الكهربائية بالإضافة إلى الإصلاحات والأحداث الناتجة عن التحميل الزائد مع التواريخ والظروف.
ملف الحمل: الحمل الأقصى، عامل التحميل، أو على الأقل الذروة سنويًا والطاقة الموردة.
سجلات الفشل والانقطاعات مع الأسباب.
بيانات التكلفة: تكاليف الاستحواذ والصيانة، والانقطاعات.
تنفيذ الاستراتيجية: خارطة طريق من 6 خطوات
إنشاء أساس بيانات: دمج سجلات الأصول وسجلات الاختبار في نظام واحد وسد الفجوات باستخدام أخذ عينات أولية على مدى 12-18 شهرًا.
التقسيم والحساب: تحديد الأهمية وقياس درجات الحالة للأسطول ككل.
تحديد العتبات والاستجابات: استخدام معايير IEEE C57.104 / IEC 60599 لعتبات القياس مع مستويات استجابة مختلفة والأشخاص المسؤولين.
الانتقال إلى نموذج هجين: بدلاً من الفواصل الثابتة، تطبيق تكرار الاختبار بناءً على المخاطر.
إجراء الاستبدالات: تطبيق الخسائر المحسوبة ومراجعة القواعد حول متى يتم إصلاح الوحدات ذات معدلات الخسارة العالية جدًا.
التحليل السنوي: كشف نتائج الإجراءات المتوقعة مقارنةً بالنتائج الحقيقية وضبط العتبات.
مصائد التكلفة وكيفية تجنبها
- فعل تعظيم المدخرات في تحسين الصيانة: تقليل وقت تعطل قسم حماية المحولات وتجنب الخسائر بسبب عطلها يمكن أن يساعد ميزانية الشركة في توفير حوالي $300 سنويًا، بينما يكلفها... $250,000 بسبب الفشل. كما قلت، قم بتطوير وتعديل إجراءات الصيانة وفقًا لمخاطر الفشل المرتبطة بها.
تجاهل دمج الخسائر في عملية اتخاذ القرار: البقاء مع الآلات القديمة ذات الأداء السيئ والتي تعاني من خسائر عالية قد يكلف أكثر في الخسائر من أي نفقات مالية مرتبطة باستبدالها.
إجراء حسابات خصم أو تعرفة خاطئة: تتغير القيم عند الرسملة أو الخصم وفقًا لأسعار الكهرباء ومعدلات الخصم؛ تأكد من توثيق افتراضات حساباتك واستخدمها لإعادة إجراء الحسابات والنمذجة عندما تحتاج التعريفات إلى تصحيح.
تجاهل عواقب الانقطاع: نماذج حساب تكلفة الانقطاع التي تتجاهل خسارة الإنتاج بسبب المعدات المعطلة والغرامات الناتجة عن الأعطال تقلل من تقدير الحاجة إلى الآلات الرئيسية.
نقص استمرارية البيانات: استراتيجية تعتمد على بيانات غير متحكم فيها وغير منسقة تؤدي إلى تصنيفات غير صحيحة وميزانيات غير مبررة.
الأسئلة المتكررة
ماذا يعني إجمالي تكلفة الملكية بالنسبة لمحولة؟
TCO هو القيمة الحالية لجميع التكاليف على مدى عمر الأصل: الاستحواذ، خسائر الطاقة، التشغيل والصيانة، تكاليف الفشل المتوقعة، والتخلص. بالنسبة لمحولة الطاقة، تمثل خسائر الطاقة عادةً 50-70 في المئة من TCO، مما يتجاوز بكثير سعر الشراء، ولهذا السبب تهيمن مواصفات الخسارة وانضباط التحميل على اقتصاديات دورة الحياة.
كيف تحسب تكلفة دورة الحياة لمحولة؟
اجمع القيمة الحالية لـ: الشراء والتركيب؛ تكلفة الخسارة السنوية (خسارة عدم التحميل × الساعات × التعرفة، بالإضافة إلى خسارة التحميل × عامل التحميل² × الساعات × التعرفة، المخصومة على مدى الحياة)؛ التشغيل والصيانة السنوية؛ تكلفة الفشل المتوقعة (احتمالية الفشل × العواقب)؛ والتخلص. استخدم معدل خصم يتراوح بين 5-10 في المئة وعمر يتراوح بين 25-40 عامًا.
ما هو ميزانية الصيانة السنوية المعقولة لكل محولة؟
بالنسبة لمحولة متوسطة القدرة، يكلف برنامج قائم على الحالة بالكامل، جولات يومية، تحليل الغاز المذاب السنوي، جودة الزيت، والاختبارات الكهربائية، حوالي $1,500–$5,000 سنويًا. الوحدات الحرجة مع المراقبة عبر الإنترنت تضيف $25,000–$120,000 في رأس المال. مقابل تكلفة استبدال تتراوح بين $250,000–$1.5 مليون، فإن هذه الميزانية تعتبر تأمينًا صغيرًا.
متى يجب استبدال المحولة بدلاً من إصلاحها؟
استبدل عندما تتجاوز تكلفة الإصلاح 50-70 في المئة من تكلفة الاستبدال، عندما تكون الحياة المتبقية للوحدة قصيرة (عادةً أكثر من 30-35 عامًا مع تأكيد شيخوخة العزل)، أو عندما تجعل مدخرات الخسارة المرسملة للمعدات الجديدة ومخاطر الفشل المنخفضة الاستبدال أرخص من حيث القيمة الحالية. العمر وحده ليس المعيار؛ الحالة واقتصاديات الخسارة هي.
كم تكلف خسائر المحولات على مدى عمر الأصل؟
محول بقدرة 10 MVA يفقد حوالي 30 kW عند التحميل النموذجي يكلف حوالي $20,000–$50,000 سنويًا في الخسائر عند $0.10–$0.14/kWh، وهو ما يعادل $300,000–$750,000 على مدى فترة تقييم مدتها 20 عامًا من حيث القيمة الحالية، وغالبًا ما يكون أكثر من سعر الشراء. قيم الخسارة الرأسمالية من $2,000–$7,000/kW بدون تحميل و$500–$1,500/kW عند التحميل هي معيار في تقييم مناقصات المرافق.
المراجع
- IEC 60076-1: المحولات الكهربائية — عام — الأساس القياسي للتصنيف، والخسائر، وبيانات الكفاءة المستخدمة في تقييم دورة الحياة.
- IEC 60076-7: دليل التحميل لمحولات الطاقة المغمورة بالزيت — المرجع للتحميل، ودرجة الحرارة، والشيخوخة الذي يغذي نماذج تكلفة الخسارة.
- IEC 60422: إرشادات الإشراف والصيانة للزيوت العازلة المعدنية — حدود مراقبة الزيت والصيانة المستخدمة في البرامج المعتمدة على الحالة.
- IEEE C57.104: دليل لتفسير الغازات الناتجة في المحولات المغمورة بالزيت — عتبات DGA التي تدفع تقييم الحالة وقرارات الصيانة.
- سيجرé — كتيبات فنية حول إدارة أصول المحولات، وتكلفة دورة الحياة، وقرارات نهاية العمر.
- IEEE — استبيانات موثوقية وبيانات اقتصاديات الصيانة من مجموعات العمل IEEE.
- شركة جيانغسو سوبين للطاقة الكهربائية — مصنع محولات متوافق مع IEC 60076 يدعم تصميمات منخفضة الخسارة وشراء يركز على TCO.
الخاتمة
يعتمد خطة التشغيل والصيانة لمحولات O&M على تكلفة دورة الحياة على الحسابات بدلاً من الحدس. يصنف الأسطول ويوجه نفقات الصيانة بناءً على الحالة والأهمية؛ يقيم الإصلاحات/الاستبدالات من خلال الخسائر الرأسمالية ويقسم الميزانية كل عام وفقًا للنتائج التي تم الحصول عليها في الممارسة العملية. النتيجة هي ميزانية مع الدفاع وملف موثوقية مع انخفاض النفقات.
استند إلى TCO في اتخاذ القرارات.
قم بالانتقال من النفقات المعتمدة على التقويم إلى النفقات المعتمدة على الحالة.
اعتبر الاستبدالات والإصلاحات في ضوء مقدار الخسارة الرأسمالية.
صنف الآلات ورتبها وفقًا لحالتها، وأهميتها، وعواقبها.
احتفظ بالبيانات حول حالتها طوال حياتها بالكامل.
بالنسبة للأساطيل التي يتم تجديدها، فإن تصميمات المحولات منخفضة الخسارة هي أكبر رافعة TCO متاحة. شركة جيانغسو سوبين للطاقة الكهربائية تصنع محولات متوافقة مع IEC 60076 تصل إلى 110 kV بمستويات خسارة مناسبة للتقييم الرأسمالي، مما يساعد الملاك على تقليل تكلفة دورة الحياة. اطلب مواصفات وعرض خسارة على subian-electric.com.