


Die Veröffentlichung des neuen Energieberichts der State Grid Corporation of China im Juli 2024 enthüllte eine Schlüsselzahl, die die größte Aufmerksamkeit der Beschaffungsabteilungen auf sich zog: die Menge an Energie, die in der Region aus neuen Energiequellen erzeugt wurde, erreichte 1,2 Billionen kWh im Jahr 2023, ein Volumen, das ausreicht, um fast jedes Zuhause im Land mit Strom zu versorgen. Wenn man Transformatoren, Schaltanlagen oder Speichereinrichtungen benötigt, ist diese Zahl im Beschaffungsprozess von Bedeutung, da jede Terawattstunde Energie, die sowohl aus Solar- als auch aus Windenergie erzeugt wird, einen gefertigten, getesteten und gelieferten Transformator bedeutet.
Dieser Artikel befasst sich mit den Auswirkungen von 1,2 Billionen kWh, seiner Position im gesamten Erzeugungsprozess von Energie in China, dem Anteil der Stromproduktion aus Wind- und Solarenergiequellen und der Bedeutung des Nutzungsverhältnisses für die genannte Energiemenge. Darüber hinaus bietet der Artikel Informationen zu zukünftigen Bestellungen der benötigten Ausrüstung, zur Modifikation ihrer Spezifikationen sowie zu Preisen und Lieferbedingungen.
Im Jahr 2023 erreichte die Erzeugung aus erneuerbaren Energiequellen (Wind und Solar) im State Grid-Korridor insgesamt 1,2 Billionen kWh, was 16,9% des Gesamten entspricht. Im Allgemeinen betrug die Menge an Energie, die aus Wind genutzt wurde, 886 TWh und die aus Sonnenlicht 584 TWh, insgesamt 1,43 Billionen kWh bis heute und macht 15,8% des gesamten Energieverbrauchs aus. Die Effizienzwerte waren recht gut, wobei Windkraftanlagen eine Leistung von 97,3% und Solarenergieanlagen 98% zeigten. Nachdem die Menge an Strom, die mit Hilfe von Entwurfsgeräten bereitgestellt werden muss, berechnet wurde, wird klar, dass für jede neu erzeugte 1.000 kW Energie aus erneuerbaren Quellen Bestellungen für mehrere Transformatoren und möglicherweise einige Niederspannungs- und Mittelspannungs-Schaltanlagen aufgegeben werden.
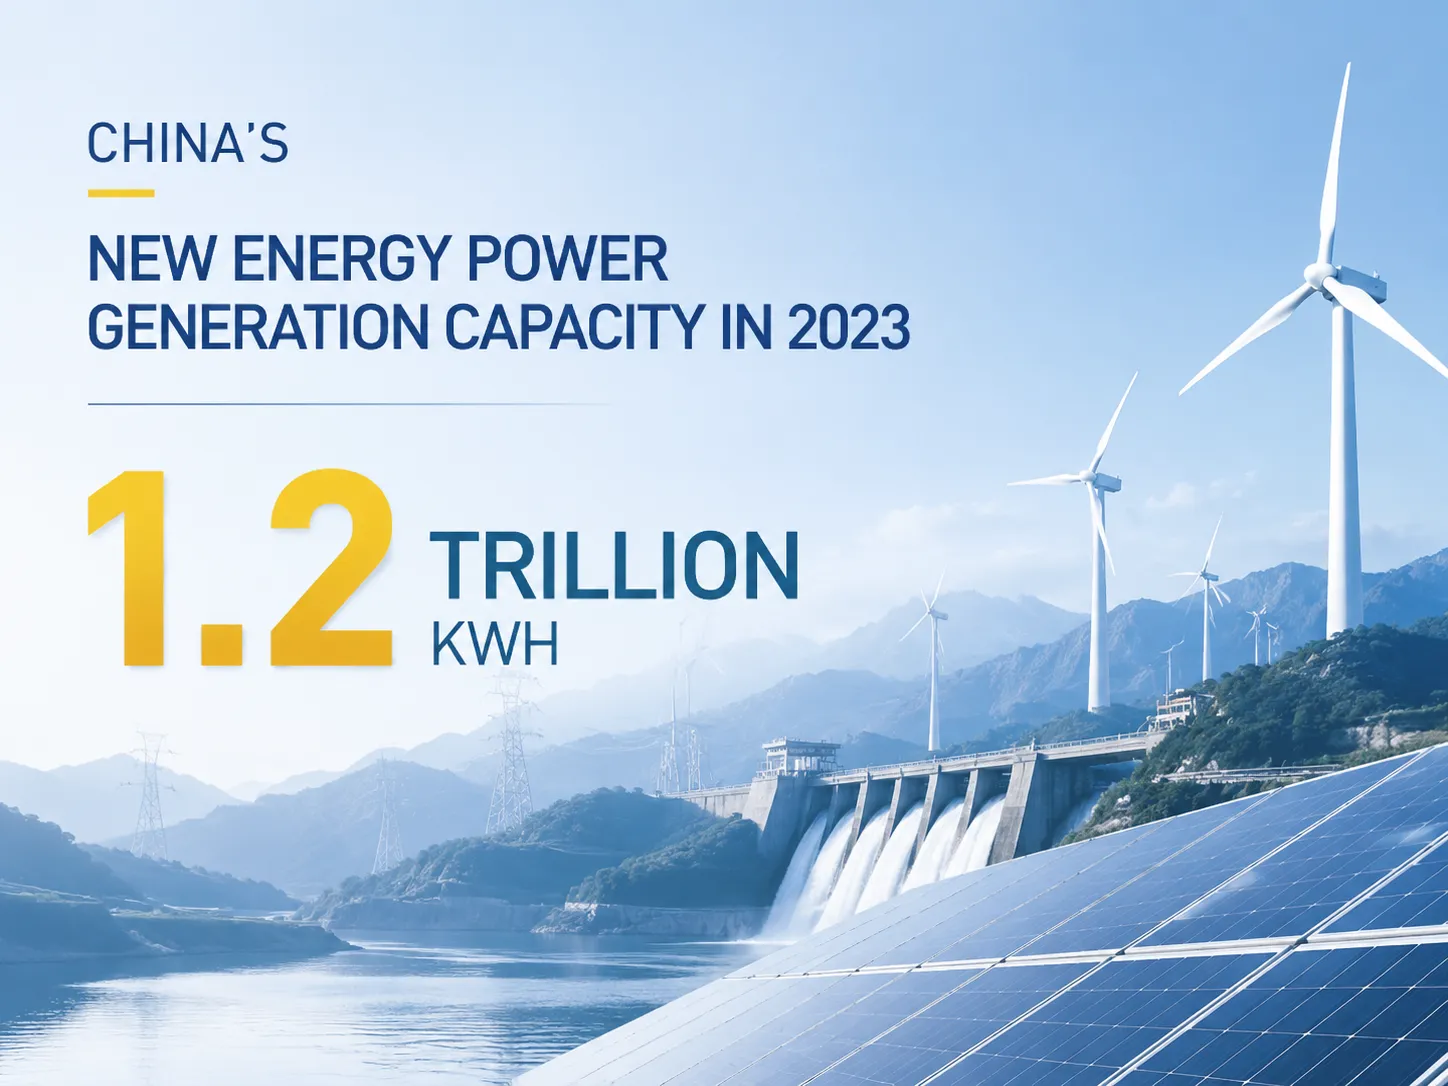
Was die Zahl von 1,2 Billionen kWh tatsächlich abdeckt
Laut dem State Grid Service New Energy Development Report 2024 basiert der Erfolg von 1,2 Billionen kWh auf dem Betrieb der State Grid Corporation of China, die etwa 26 Provinzen und fast 88% des Stromnetzes abdeckt. Im Jahr 2023 fügte dieses Gebiet 226 GW an Wind- und Solarstromkapazität hinzu, wodurch die gesamte Installation erneuerbarer Energien auf etwa 870 GW oder 37,7% des gesamten Stroms in der Region anstieg. Die Erzeugung erneuerbarer Energien erreichte 1,2 Billionen kWh, was einem Anstieg von etwa 2,0% im Prozentsatz der Energieerzeugung entspricht.
Auf nationaler Ebene sind die Zahlen größer. Die gesamte Erzeugung aus Wind- und Solarenergie im Betriebsbereich des Southern Power Grid betrug laut der Nationalen Energieverwaltung etwa 1,43 Billionen kWh. Dies ist die höchste Zahl, die von der NEA veröffentlicht wurde, und hilft hervorzuheben, wie saubere Energie in den Mainstream übergegangen ist.
| Region / Umfang | Erneuerbare Energieerzeugung 2023 | Anteil der Erzeugung |
|---|---|---|
| Betriebsbereich des State Grid | 1,2 Billionen kWh | 16.9% |
| National (alle Netze) | 1,43 Billionen kWh | ~15,8% des Stromverbrauchs |
| Chinas Haushaltsverbrauch (Vergleich) | 1,35 Billionen kWh | – |
Der Unterschied ist wichtig in Bezug auf genaue Informationen in Beschaffungsdokumenten; 1,2 Billionen kWh bezieht sich auf den relevanten Bereich des Staatsnetzes, während der Ausdruck 1,43 Billionen kWh der nationalen Wind-Plus-Solar-Zahl entspricht. Beide Zahlen existieren und vermitteln die gleiche Botschaft – das Volumen ist so hoch, dass die Ausrüstungskette, die es bereitstellt, der größte Verbraucher von Leistungstransformatoren unter den Industrien weltweit ist.
Das nationale Bild: Wind und Solar in Zahlen
Die Nationale Energieverwaltung (NEA) hat den Bericht zur Überwachung erneuerbarer Energien für Chinas 2023 veröffentlicht. Der Bericht zeigt einige wichtige Kennzahlen der Branche zum Ende dieses Jahres. Dazu gehört eine gesamte installierte Kapazität erneuerbarer Energien von 1.516 GW, was einem Anstieg von 25% entspricht, und eine gesamte erneuerbare Erzeugung von 2,95 Billionen kWh, was 31,8% der Gesamterzeugung entspricht. Die verschiedenen erneuerbaren Energiequellen trugen zu diesem Gesamtwert bei, darunter Wasserkraft mit 1,28 Billionen kWh erzeugt, Windkraft mit 886 TWh, Solarenergie mit 584 TWh und Biomasseerzeugung von 198 TWh.
| Quelle | Erzeugung 2023 | Anteil an der Gesamterzeugung |
|---|---|---|
| Alle erneuerbaren Energien | 2,95 Billionen kWh | 31.8% |
| Wasserkraft | 1,28 Billionen kWh | 13.8% |
| Wind | 886 TWh | 9.5% |
| Solar-PV | 584 TWh | 6.3% |
| Biomasse | 198 TWh | 2.1% |
Die Auswirkungen sind auffällig. Erstens übersteigt die kombinierte Erzeugung von Wind- und Solaranlagen jetzt die von Wasserkraft, der Hauptquelle für saubere Energie in China seit Jahrzehnten. Zweitens, mit einer kombinierten Erzeugung von 1,43 Billionen kWh liegt ihr Anteil am Gesamtverbrauch jetzt bei etwa 15,8% im Vergleich zum weltweiten Durchschnittswert von 13%. Daher hat China in weniger als 10 Jahren den Wandel von einem Rückstand bei globalen Trends in Bezug auf saubere Energie zu einem der Führer vollzogen.
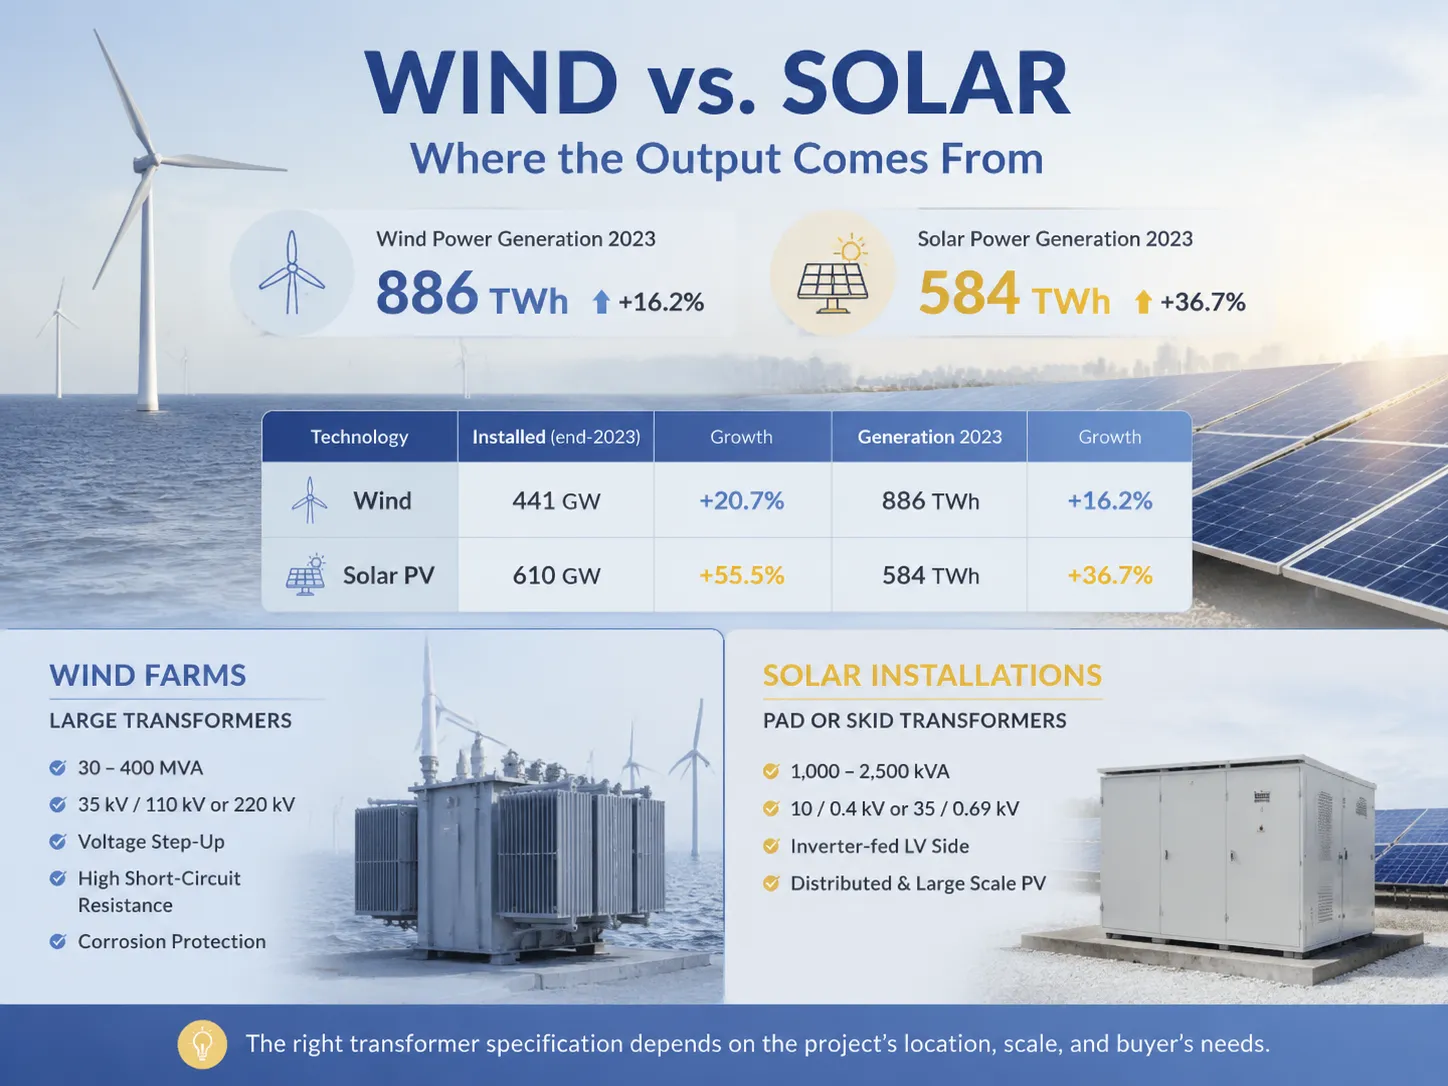
Wind vs. Solar: Woher die Erzeugung kommt
Die Menge an Strom, die aus Windenergie erzeugt wird, stieg um 16,2% auf 886 TWh, verglichen mit dem Anstieg der Solarenergie, die 36,7% erreichte und 584 TWh ausmachte. Solche Entwicklungsraten resultieren aus der Tatsache, dass der Bau von Solaranlagen weniger Zeit in Anspruch nimmt, kostengünstiger ist und Solarmodule verwendet werden, die auf den Dächern von Gebäuden installiert werden können.
| Technologie | Installiert (Ende 2023) | Wachstum | Erzeugung 2023 | Wachstum |
|---|---|---|---|---|
| Wind | 441 GW | +20.7% | 886 TWh | +16.2% |
| Solar-PV | 610 GW | +55.5% | 584 TWh | +36.7% |
Die Verteilung von Wind und Solar bestimmt die Auswahl der zu spezifizierenden Transformatoren. Windparks, einschließlich Offshore-Anlagen, benötigen in der Regel größere Transformatoren zur Hochspannungserhöhung, mit gängigen Nennleistungen von 30-400 MVA in den Spannungsklassen 35 kV/110 kV oder 220 kV sowie Kurzschlussfestigkeit und Korrosionsschutz. Im Gegensatz dazu verwenden verteilte Solar- und großflächige PV-Anlagen typischerweise aufgeständerte oder fahrbare Einheiten mit einer Nennleistung von 1.000-2.500 kVA in den Spannungsklassen 10/0,4 kV oder 35/0,69 kV, wobei Wechselrichter verwendet werden, um die Niederspannungsseite zu speisen. Letztendlich ist es die Position des Käufers, die einem Transformator-Spezifizierer hilft, die benötigten Spezifikationen zu bestimmen.
Auslastungsraten: 97,3% und 98,0%
Rohzahlen vermitteln möglicherweise nicht das vollständige Bild, aber die Auslastungsraten zeigen, ob das Netz in der Lage ist, das produzierte Volumen aufzunehmen. Im Jahr 2023 lag in China die durchschnittliche Windnutzungsrate bei 97,3%, was einem Anstieg um 0,5 Punkte entspricht, während die Solarquote um 0,3 Punkte leicht zurückging und somit 98,0% erreichte. Beide Werte liegen international auf einem hohen Niveau, jedoch deutet der leichte Rückgang der Solar-Nutzung darauf hin, dass die Solarerzeugungskapazität die Fähigkeit des Netzes übersteigt, sie anzuschließen und zu transportieren.
Die oben genannte Einschränkung hat zu einem Wandel der Diskussion über Ausrüstung in China hin zu Flexibilität geführt: Batteriespeichersysteme, Pumpspeicher (die 2023 51 GW erreicht haben) und dynamische Transformatorabgriffsteuerungen. Wenn ein Transformator für einen Solarpark in einem Gebiet ohne Nachfrage nach mittäglicher Solarproduktion arbeitet, sollte der Transformator über breitere Abgriffbereiche verfügen, häufiger mit OLTC betrieben werden und akzeptable Verlustwerte unter Teillasten aufweisen, was bedeutet, dass er möglicherweise nur mit 20-40% seiner Kapazität arbeitet.
Was 1,2 Billionen kWh für das Netz bedeutet
Es ist kein Zufall, dass insgesamt 1,2 Billionen kWh variable Erzeugung integriert wurden. Die State Grid hat 19 AC- und 16 DC-UHV-Leitungen eingerichtet oder aufgerüstet, 94 GW Pumpspeicher betrieben, entweder in Betrieb oder in Entwicklung, und die nationale “Cloud-Plattform für neue Energien” initiiert, um die Anwendung von Verbindungen im Land zu verwalten. Das Ergebnis ist, dass ein Verteilungs- und Untertransmissionsnetz in einem beispiellosen Maßstab rekonstruiert wird – es handelt sich um dasselbe 110-kV- und niedrigere Netz, das 2023 55% an Investitionen angezogen hat.
In Bezug auf die praktischen Probleme, mit denen die Transformatorenindustrie konfrontiert ist, bedeutet dies, dass erneuerbare Anlagen über kurze Zuleitungen angeschlossen sind, was zu einer sehr hohen Fehlerstrombelastung für die Transformatoren am Anschlusspunkt führt. Darüber hinaus sind Transformatoren, die an diesem Anschlusspunkt installiert sind, Stromstößen aufgrund von Schaltvorgängen, harmonischen Komponenten, die aus der Arbeit von Wechselrichtern entstehen, und täglichen thermischen Veränderungen ausgesetzt, die für herkömmliche Verteilungstransformatoren nicht charakteristisch sind. Folglich suchen Unternehmen nun nach Transformatoren für erneuerbare Energien, die über eine erhöhte Fähigkeit zur Kurzschlussfestigkeit verfügen.
Der Nachfrage-Motor für Transformatoren und Schaltanlagen
Jedes neue Gigawatt an erzeugter Energie aus Wind- oder Solarquellen würde etwa 2-3 Transformatoren erfordern, abhängig von der Größe der installierten Einheit sowie bestimmten Einheiten von Niederspannungsschaltanlagen und Mittelspannungsschaltanlagen zum Schutz des Sammelsystems. Wenn man diese Faustregel auf die 2023 hinzugefügte neue Wind- und Solarkapazität von 243 GW anwendet, zeigt sich, dass allein in einem Jahr 60.000-80.000 Transformatoren für die Anschlüsse von erneuerbaren Energiesystemen gekauft werden müssten, zusätzlich zum regulären Austausch- und Aufrüstungsprogramm des Netzes.
| Anwendung | Typische Nennleistung | Richtpreis (FOB China) | Vorlaufzeit |
|---|---|---|---|
| Transformator für verteilte Solarwechselrichter | 100-315 kVA | $2,500-$8,000 | 8-10 Wochen |
| Utility PV / kleine Windkraft Hochspannung | 500-1.000 kVA | $9,000-$20,000 | 8-12 Wochen |
| Erneuerbare Farm Sammlungseinheit | 500-2.500 kVA | $20,000-$45,000 | 10-16 Wochen |
| Offshore-Wind-Hochspannungstransformator | 30-100 MVA | $250,000-$1,500,000 | 6-12 Monate |
Die Kosten hängen von den Spezifikationen, der Marke und der geografischen Region ab. Offshore-Modelle haben hohe Korrosions- und Testkosten. Dieser Trend ist jedoch klar erkennbar: Der Boom im Bereich erneuerbarer Energien hat den Großteil der Fertigungskapazitäten beansprucht, und gewöhnliche Verteilungstransformatoren, die früher innerhalb von 4-6 Wochen geliefert wurden, können jetzt bis zu 8-16 Wochen benötigen.
2024 und darüber hinaus: Wohin das Wachstum führt
Dieses Muster setzte sich bis 2024 fort, als die installierte Kapazität im Windbereich etwa 510 GW und die Kapazität im Solarbereich ungefähr 840 GW erreichte. Die Auslastung lag Ende 2024 bei rund 951 TWh. Zwischen Januar und Juli 2024 wurde eine Gesamtstromerzeugung aus Wind und Solar von 1.055 TWh in nur sieben Monaten erreicht (etwa 201 TWh der Gesamtstromerzeugung), was bereits höher war als der gesamte Stromverbrauch des dritten Sektors in diesem Zeitraum.
Folglich deutet die realistische Nachfrageprognose für neue Ausrüstung nicht auf einen Anstieg des Verbrauchs hin, sondern auf stabile Verkaufszahlen von Ausrüstung. Es wird geschätzt, dass die Menge während des 14. Fünfjahresplans (2021-2025) und auch im 15. Zeitraum für sowohl NEA als auch CEC jährlich über 200 GW erreichen wird. Daher müssen Unternehmen grüne Transformatoren als stabile Produktlinie betrachten und nicht als Ausnahme.
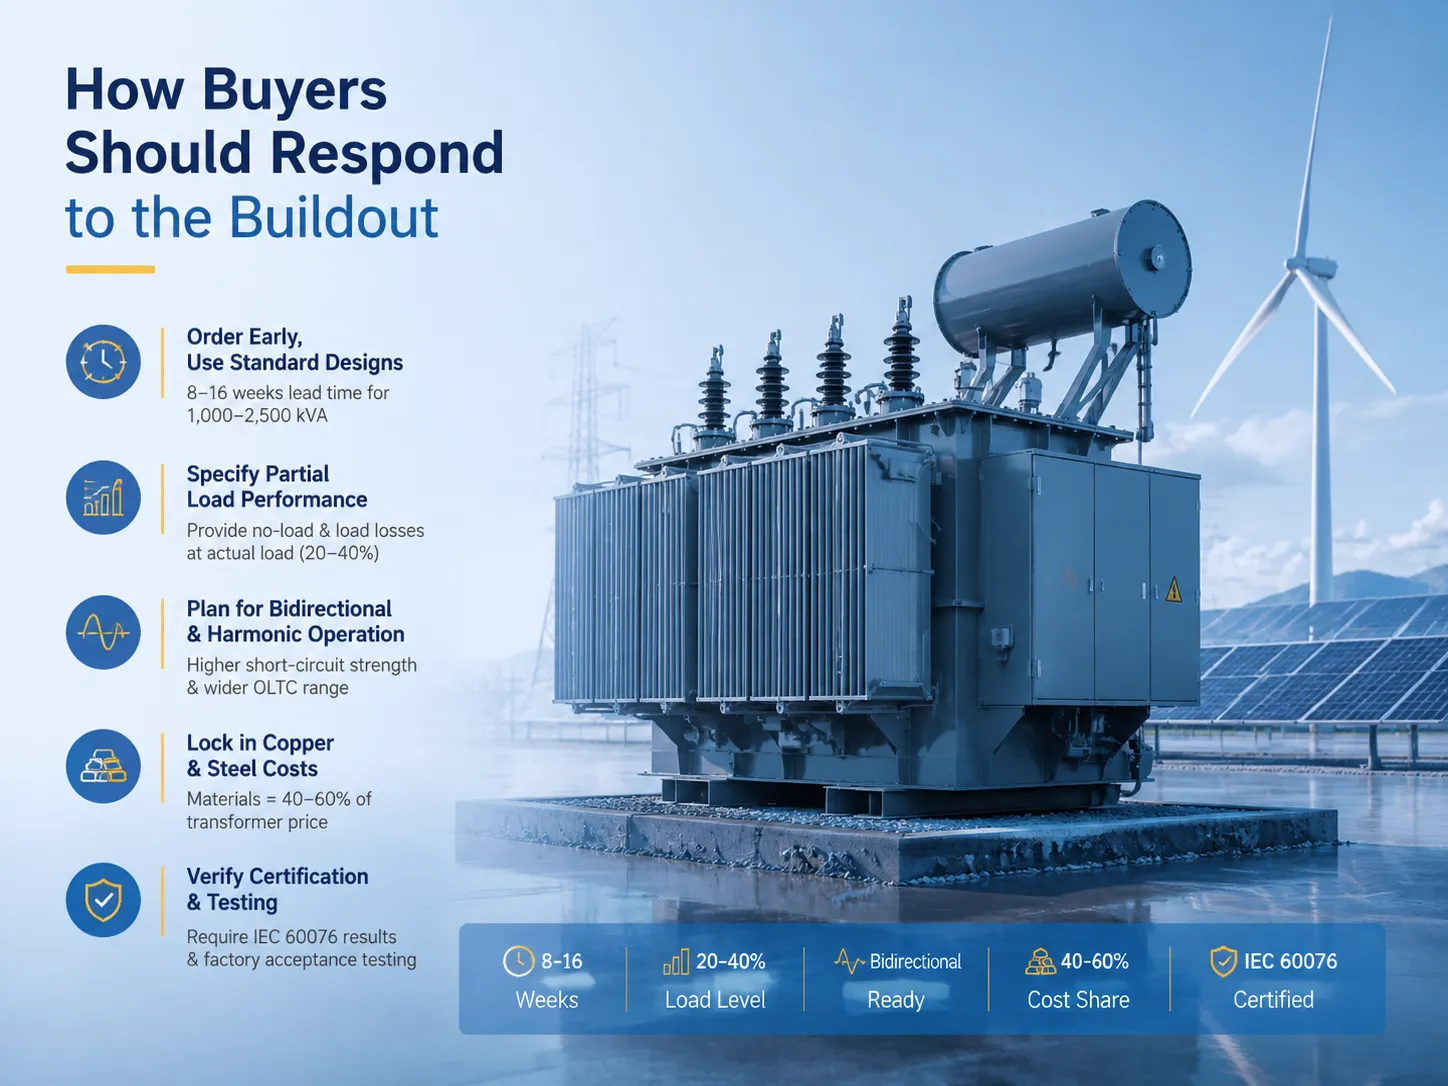
Wie Käufer auf den Ausbau reagieren sollten
Dies sind einige praktische Schritte, wenn Sie planen, Transformatoren entweder für erneuerbare Energien oder zur Erweiterung Ihres Netzes zu kaufen:
- Bestellen Sie im Voraus und verwenden Sie standardisierte Designs. Standarddesigns im Bereich von 1.000-2.500 kVA haben die kürzeste Lieferzeit (zwischen 8 und 16 Wochen). Wenn Sie kundenspezifische Anschlüsse, spezielle Impedanzwerte oder nicht standardisierte Spannungsniveaus verwenden, kann sich die Lieferzeit erheblich verlängern, während die Kosten der gekauften Transformatoren um etwa 10-25 % höher bleiben.
- Fordern Sie Teillast-Spezifikationen an. Gemäß den Spezifikationen sollten Sie Leerlaufverluste und Lastverluste basierend auf dem tatsächlichen Lastniveau des Transformators während des Betriebs angeben (was 20-40 % anstelle von 100 % sein kann).
- Berücksichtigen Sie bidirektionalen und harmonischen Betrieb. Wenn Sie den Transformator mit Speicher oder einem hohen Anteil an Solarstrom verbinden, ist es notwendig, Anforderungen hinsichtlich der höheren Kurzschlussfestigkeit der Ausrüstung und eines größeren OLTC-Bereichs als bei einem regulären Transformator einzubeziehen.
- Sichern Sie die Kosten für Kupfer und Stahl ab. Diese Materialien machen 40-60 % des Transformatorpreises aus. Sie sollten die Lieferanten bitten, Preisindexierungen in die Verträge für die Produkte aufzunehmen.
- Stellen Sie die Zertifizierung der gelieferten Transformatoren sicher. Lieferanten sollten Ihnen IEC 60076-Ergebnisse und das Werksabnahmeprüfverfahren bereitstellen, bevor Sie von den Angeboten anderer Lieferanten erfahren.
Hersteller, die den Ausbau der erneuerbaren Energien bedienen
Die Anbieter, die in diesem Bereich präsent sind, passen gut in etablierte Kategorien. Bekannte Unternehmen wie Siemens Energy, Hitachi Energy und ABB führen den Markt für Offshore-Windturbinen und Hochspannungstransformatoren dank ihrer Ingenieurfähigkeiten und Servicelösungen, die ihren Produkten einen Mehrwert verleihen. Schneider Electric ist für Niedrig-/Hochspannungstransformatoren und digitale Steuerungssysteme im Bereich der erneuerbaren Energien zuständig. Was die chinesischen Unternehmen TBEA, Baoding Tianwei und China XD Group betrifft, so bieten sie eine Vielzahl von Produkten auf dem inländischen und internationalen Markt zu wettbewerbsfähigen Preisen an.
| Hersteller | Positionierung | Erneuerbare-relevante Produkte |
|---|---|---|
| Siemens Energie | Premium | Große Leistungstransformatoren, Offshore-Plattformen |
| Hitachi Energie | Premium | Netzverbindung, HVDC, große Hochstufungen |
| ABB | Premium | Verteilungs-Steigerungen, LV/MV-Schaltanlagen |
| Schneider Electric | Mittel-Premium | Niederspannungsschaltanlagen, digitale Überwachung |
| TBEA / Baoding Tianwei / XD Gruppe | Volumen | Verteilung zur 1.000 kV-Klasse |
| Jiangsu Subian Electric Power | Wettbewerbsfähig | IEC 60076-zertifizierte Verteilungs- und Mittelspannungstransformatoren |
Für Käufer, die nach Geräten mit Zertifizierung zu wettbewerbsfähigen Preisen suchen, ohne die Jahre, die die globale Ingenieure benötigen, repräsentiert Jiangsu Subian Electric Power das chinesische Mittelsegment. Es hat die IEC 60076-Zertifizierung und hat ölgetauchte und trockene Verteilungstransformatoren an Projekte der erneuerbaren Energien und Infrastrukturprojekte in verschiedenen Teilen Asiens, Afrikas, des Nahen Ostens und Lateinamerikas geliefert. Die Lieferzeit liegt zwischen 8 und 16 Wochen und umfasst ebenfalls Testdokumentationen.
Häufig gestellte Fragen
Was bedeutet “1,2 Billionen kWh” im Titel?
Was die neue Energie (Wind- und Solarenergie) in dem Betriebsbereich des Staatsnetzes im Jahr 2023 betrifft, so macht sie 16,9% der Gesamtproduktion in diesem Bereich aus. In Bezug auf die Gesamtproduktion des Landes betrug die Menge an erzeugter Energie, die eine Mischung aus Wind- und Solarenergie im Jahr 2023 darstellt, 1,43 Billionen kWh. Die genannten Zahlen sind genau: Im Falle der ersten stammt sie aus dem Bericht des Staatsnetzes, während die letztere Zahl von der Nationalen Energieverwaltung zitiert wird.
Wie viel von Chinas Strom stammt jetzt aus Wind- und Solarenergie?
Im Jahr 2023 betrug die gesamte Menge an verbrauchtem Strom 1,43 Billionen kWh, die aus Wind- und Solarenergiequellen stammt, was etwa 15,8% des gesamten Verbrauchs ausmacht. Der Anteil der Windenergieerzeugung betrug 9,5% und die Solarenergieerzeugung stellte 6,3% des gesamten verbrauchten Stroms dar. Die Auslastungsraten blieben auf einem sehr hohen Niveau, wobei Wind 97,3% und Solar 98% erreichten, während die Solarabschaltung leicht anstieg.
Welche Transformatoren benötigt ein Solar- oder Windpark?
In der Regel wird für jede 1-10 Megawatt (MW) an Kapazität, die von einem Wechselrichter oder einer Turbine erzeugt wird, ein einzelner Hochstufungstransformator verwendet. Verteilte Solartechnologie nutzt Niederspannung (LV) Transformatoren mit einer Kapazität von 100 bis 315 Kilovolt-Ampere (kVA); Versorgungs-Solar-PV-Systeme und kleinere Windanlagen benötigen Transformatoren mit einer Kapazität von 500 kVA bis 2.500 kVA, während große Windkraftanlagen Sammeltransformatoren mit einer Kapazität von 30 MVA bis 100 MVA für Spannungen von 35/110 Kilovolt (kV) und 220 kV verwenden. Offshore-Turbinen führen zu zusätzlichen Kosten im Zusammenhang mit Korrosion und Tests sowie zu verlängerten Lieferzeiten.
Wie hat der Ausbau erneuerbarer Energien die Transformatorpreise und Lieferzeiten beeinflusst?
Es gibt eine begrenzte Produktionskapazität. Der Preis eines 100 kVA Verteilungstransformators liegt jetzt zwischen $2.500 und $5.000 FOB China, und für eine 2.000 kVA erneuerbare Step-Up-Einheit liegt er zwischen $20.000-$45.000. Die Lieferzeit für Standarddesigns hat sich jetzt auf 8-16 Wochen verlängert. Zuvor betrug die Lieferzeit 4-6 Wochen vor der Hochlaufphase. Große Leistungstransformatoren zur Anbindung an das Netz haben eine noch längere Lieferzeit von 6-12 Monaten.
Was sollte ich für einen Transformator angeben, der eine Solaranlage speist?
Verstärkte Kurzschlussfestigkeit, Kostenwerte, die unter Berücksichtigung der tatsächlichen Lasten (in der Regel 20-40% des Tages) berechnet werden, größere OLTC-Abgriffbereiche, bei denen die Spannung mit unterschiedlichen Strömen variiert, und geeigneter harmonischer Inhalt unter Berücksichtigung von Wechselrichtern. Wenn jedoch Speicher angeschlossen ist, bereiten Sie bidirektionale Stromflüsse für die Spezifikation vor.
Referenzen
- Nationale Energieverwaltung (NEA) – Herausgeber des Berichts zur Überwachung und Bewertung der nationalen Entwicklung erneuerbarer Energien 2023, Quelle der nationalen Wind-Solar-Erzeugungszahlen.
- China Electricity Council (CEC) – Quelle für installierte Kapazität, Erzeugungsmix und Netzinvestitionsstatistiken, die in diesem Artikel zitiert werden.
- IEA Erneuerbare 2023 – Internationale Analyse des Ausbaus von Solar- und Windenergie, einschließlich Chinas Anteil an den globalen Zuwächsen.
- IEA: Länderprofil China – Kontext zu Chinas Zielen für erneuerbare Energien und Herausforderungen bei der Netzintegration.
- IEC 60076-1: Leistungstransformatoren – Allgemeines – Der Standard, der die Typprüfungen und Leistungszusagen von Transformatoren, die erneuerbare Anlagen speisen, regelt.
- IEC 60296: Mineralische Isolieröle – Ölqualitätsstandard, der für Transformatoren mit erneuerbarer Nutzung, die unter thermischen Zyklen arbeiten, relevant ist.
- Jiangsu Subian Electric Power – IEC 60076-zertifizierter Hersteller von Verteilungs- und Mittelspannungstransformatoren für erneuerbare und Infrastrukturprojekte.
Fazit
Der aktuelle Bericht, der zeigt, dass Chinas Entwicklung erneuerbarer Energien insgesamt 1,2 Billionen kWh innerhalb der State Grid-Region und 1,43 Billionen kWh im ganzen Land erreicht hat, ist kein Zufall. Es ist die offensichtlichste Botschaft über den dauerhaften strukturellen Bedarf an Transformatoren und Schaltanlagen. Jedes Gigawatt Solar- und Windenergie impliziert das Vorhandensein genehmigter Transformatorentechnologie. Auch die jährlich hinzugefügten über 200 GW ermöglichen es, die Nachfrage nach Transformatoren während des gesamten Planungszeitraums fast immer hoch zu halten.
Der Plan des Käufers basiert auf den Daten: Standardformulierungen erstellen, im Voraus bestellen, Verlustmengen im teilweisen Betriebsmodus anfordern und die IEC 60076-Zertifizierung überprüfen. Wenn Sie Transformatoren für Verteilungs- oder Mittelspannungsanwendungen im Bereich erneuerbare Energien benötigen, können Sie Jiangsu Subian Electric Power kontaktieren, da es IEC 60076-zertifizierte Produkte mit einer durchschnittlichen Lieferzeit von 8-16 Wochen anbietet.