


Le directeur des achats résidant à Dubaï a trois devis pour le même transformateur de sous-station de 5MVA : un d'un géant européen avec un délai de livraison de 30 mois, un d'un fournisseur indien avec une remise de 20%, bien que de qualité douteuse, et un d'une usine chinoise qui peut le livrer en 5 mois si le processus de certification est respecté. Choisir entre les trois n'est pas une question de prix ; c'est une question de savoir où en est le marché des transformateurs et qui contrôle la capacité et l'environnement concurrentiel. Cet article fournit une carte de ce marché.
Dans cet article, vous apprendrez la taille du marché et sa croissance, la répartition par produits et régions, le cadre concurrentiel à trois niveaux définissant les délais de livraison et les marges, et l'effet de la crise d'approvisionnement existante sur les politiques des acheteurs. L'article est basé sur des données réelles tirées de divers rapports et sources internes pour vous aider à mettre ces informations à bon escient dans vos négociations et présentations.
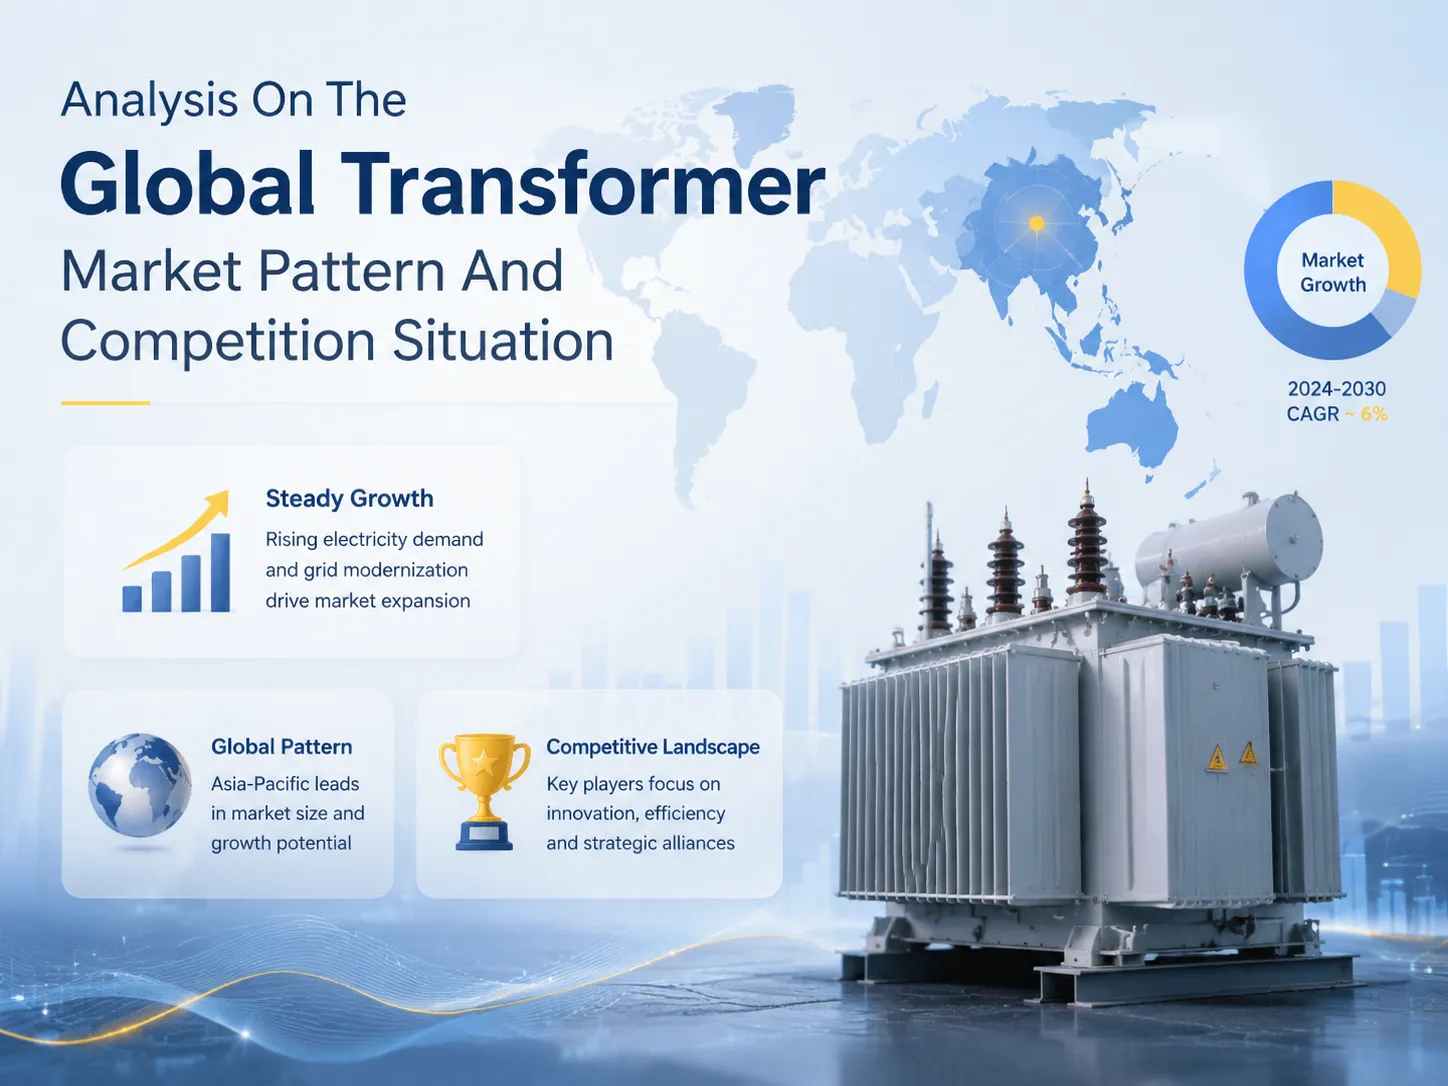
Réponse brève : Le marché mondial des transformateurs était évalué à environ $55-64 milliards en 2024, avec un taux de croissance annuel composé (CAGR) de 6.6% pour atteindre environ $122 milliards d'ici 2034. Les transformateurs de distribution représentent environ 52% de ce chiffre d'affaires tandis que la part des petits transformateurs de puissance devrait être d'environ 40%, les unités immergées dans l'huile représentant jusqu'à 80% du marché total. La plus grande région est l'Asie-Pacifique avec plus de 50% de demande, principalement en raison de la rénovation du réseau en Chine et de l'extension du réseau indien. La concurrence dans ce domaine peut être divisée en trois niveaux et comprend des multinationales, des entreprises chinoises majeures et un grand nombre de fabricants du secteur privé.
Taille du marché et trajectoire de croissance
Les méthodes de dimensionnement du marché diffèrent, cependant, les résultats sont plus ou moins similaires. Selon les données de Global Market Insights, la taille du marché a atteint $63.8 milliards en 2024, contre $54 milliards en 2022 et $58.8 en 2023, et devrait croître de 6.6% par an pour atteindre $122.7 milliards en 2034. D'autres rapports fournissent des estimations conservatrices, selon lesquelles la taille du marché en 2023 est de $45.2 milliards et elle atteindra $68.9 milliards d'ici 2030. Alors que des recherches chinoises indiquent un taux de croissance sur quatre ans de 13.5% durant les années 2020-2023.
| Année | Taille du marché (GMI) | Estimations alternatives |
|---|---|---|
| 2022 | $54.0 milliards | – |
| 2023 | $58.8 milliards | $45.2 milliards (une autre étude de 2023) |
| 2024 | $63.8 milliards | >$43 milliards (estimation Qianzhan) |
| 2030 (prévision) | ~$95 milliards | $68.9 milliards (conservateur) |
| 2034 (prévision) | $122.7 milliards | – |
La variance dans les chiffres absolus indique diverses définitions de ce qu'est un transformateur (les rapports diffèrent sur les transformateurs d'instrument, les réacteurs et les accessoires), mais le CAGR de 6.6-7.2% reste le même pour toutes les approches. Sachant que l'industrie a connu une croissance d'environ 3.5% chaque année jusqu'en 2020, il semble intéressant de comprendre les raisons pour lesquelles cette augmentation par deux du taux de croissance s'est produite.
Structure du marché par type de produit
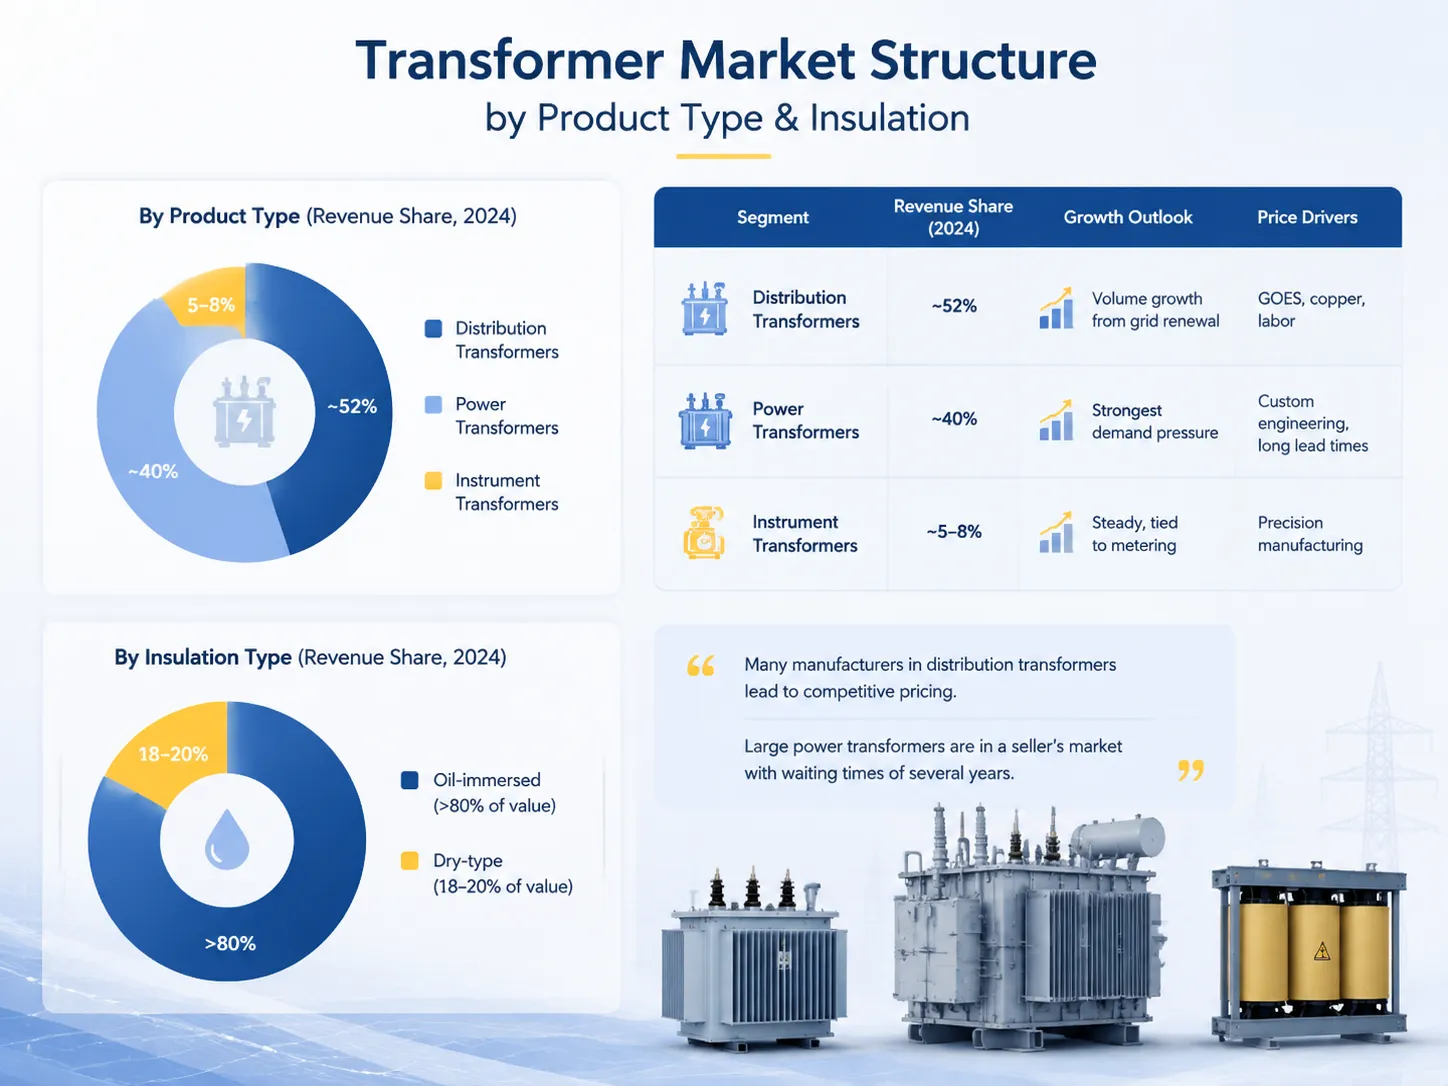
Les transformateurs de distribution devraient représenter le plus grand segment du marché en 2024, représentant 51.8% des revenus. Les transformateurs de puissance contribuent à environ 40%, tandis que la part restante provient des transformateurs d'instrument et spécialisés. En termes d'isolation, les transformateurs immergés dans l'huile devraient dominer les revenus avec plus de 80% de part, car ils sont largement utilisés dans les applications de distribution et de puissance HV. Les transformateurs à sec devraient croître plus rapidement, mais resteront une petite base en raison des réglementations de sécurité incendie dans les bâtiments, les centres de données, etc.
| Segment | Part des revenus (2024) | Perspectives de croissance | Facteurs de prix |
|---|---|---|---|
| Transformateurs de distribution | ~52% | Croissance du volume due au renouvellement du réseau | GOES, cuivre, main-d'œuvre |
| Transformateurs de puissance | ~40% | Pression de demande la plus forte | Ingénierie sur mesure, longs délais de livraison |
| Transformateurs d'instrumentation | ~5-8% | Stable, lié à la mesure | Fabrication de précision |
| Type sec (vue d'isolation) | ~18-20% de valeur | Croissance la plus rapide (sécurité incendie) | Coût de résine/d'isolation |
| Immergé dans l'huile (vue d'isolation) | >80% de valeur | Dominant, stable | Coût de l'huile et du réservoir |
La répartition des produits est importante pour les acheteurs car elle donne un aperçu des zones de concurrence intense et faible. Une multitude de fabricants de transformateurs de distribution garantit que des prix compétitifs sont possibles. En revanche, les grands transformateurs de puissance existent dans un marché de vendeur avec des délais d'attente de plusieurs années.
Le modèle régional
Le plus grand marché régional est la région Asie-Pacifique, satisfaisant plus de la moitié de la demande mondiale, grâce aux développements des systèmes de transmission et de distribution de la Chine et à l'expansion rapide du réseau indien. De plus, le Vietnam et la Thaïlande deviennent d'importants centres de fabrication. En Amérique du Nord, la part du marché reste à 22%, tandis qu'en Europe, elle est à 20% ; les deux régions mettent en œuvre d'importants programmes de remplacement de réseau impliquant des systèmes de plus de 40 ans. Les marchés d'importation à la croissance la plus rapide sont le Moyen-Orient, l'Afrique et l'Amérique latine en raison de nouvelles zones industrielles, de programmes de désalinisation et d'électrification.
| Région | Part de la demande | Caractère | Réalité de l'acheteur (2024) |
|---|---|---|---|
| Asie-Pacifique | >50% | Développement domestique + base d'exportation | Meilleure disponibilité, vérifier la certification |
| Amérique du Nord | ~22% | Flotte vieillissante, ~80% importés | Délais de livraison de plus de 100 semaines |
| Europe | ~20% | Green Deal, réseaux 40%+ >40 ans | Tarification premium, longues attentes |
| Moyen-Orient et Afrique | ~8% | Dépendant des importations, croissance rapide | Sensible au prix, sensible à la qualité |
| Amérique Latine | ~5% | Programmes d'électrification | Options compétitives de milieu de gamme |
La situation est claire : les régions ayant la plus forte croissance de la demande se caractérisent par le plus bas niveau de fabrication locale. Ainsi, le schéma de concurrence est principalement basé sur le commerce, ce qui explique la croissance continue des exportations de transformateurs en provenance de Chine, atteignant le chiffre de $6,7 milliards en 2024.
La structure concurrentielle : trois niveaux
Le paysage concurrentiel mondial est mieux compris comme trois niveaux, chacun avec une proposition de valeur différente :
| censé | Acteurs représentatifs | Part | Forces |
|---|---|---|---|
| Niveau 1 – Multinationales mondiales | Hitachi Energy, Siemens Energy, Schneider Electric, GE Vernova, Toshiba, Mitsubishi Electric | 20-30% | Technologie, réseau de services, pedigree de test de type, tarification premium |
| Niveau 2 – Grands groupes chinois | TBEA, China XD Group, Baoding Tianwei | 30-40% | Échelle, prix, certification d'exportation croissante |
| Niveau 3 – Fabricants régionaux et privés | Prolec GE, Virginia Transformer, exportateurs chinois et indiens de milieu de gamme | 30-50% | Flexibilité, rapidité, service localisé |
L'industrie domestique en Chine fabrique environ 35% des transformateurs mondiaux et a pu exercer une influence significative sur le Niveau 2 et le Niveau 3. Les cinq principaux acteurs du marché mondial représentent près de 40% du marché. Ainsi, la consolidation du marché est plus élevée dans ce secteur, ce qui est à nouveau responsable des longs délais dans le segment premium.
Acteurs clés : Qui contrôle la capacité
Connaître la carte des capacités permet au marché d'agir. Hitachi Energy est le plus grand producteur de transformateurs au monde et a déclaré une expansion d'une valeur de $6 milliards et l'embauche de 15 000 employés, bien que l'obtention de nouvelles capacités puisse prendre plus de 4 ans. Siemens Energy construit sa première grande usine de transformateurs aux États-Unis (un projet de $150 millions à Charlotte, Caroline du Nord) et a annoncé que plus de 60% de transformateurs en Europe ont plus de 25 ans. GE Vernova a signé un contrat pour 12 unités de 400 kV avec l'allemand Amprion et étend ses services dans le monde entier. Schneider Electric investit $140 millions dans l'expansion de ses opérations aux États-Unis, et Hyosung Heavy Industries a sécurisé un contrat de $240 millions, 420 kV avec Statnett, Norvège.
Dans le niveau de volume, TBEA, China XD Group et Baoding Tianwei couvrent une grande partie du marché des produits de puissance moyenne, ayant de plus en plus un certificat IEC pour l'exportation de leur équipement. En dessous d'eux se trouvent des milliers d'acteurs régionaux. Le résultat : la capacité de niveau premium est réservée pour des années à venir, la capacité de milieu de gamme est produite de manière flexible, et l'assurance qualité est la responsabilité de l'acheteur.
Facteurs de marché et tendances technologiques
Cinq facteurs devraient influencer le marché jusqu'en 2030, chacun ayant un effet/impact sur le produit d'une manière ou d'une autre :
- Renouvellement du réseau dans les marchés matures. Selon Siemens Energy, 60% et au-dessus, l'équipement de l'Europe a 25 ans de plus, tandis que la plupart des équipements américains dépassent la durée de vie standard de 35-40 ans. Cela entraînera une décennie de commandes pour des remplacements.
- Intégration des énergies renouvelables. Chaque gigawatt d'énergie éolienne ou solaire nécessite des transformateurs élévateurs. De plus, les applications d'énergie renouvelable sont actuellement le segment à la croissance la plus rapide sur le marché (~9.2% CAGR).
- Intelligence artificielle et charge des centres de données. Les grands centres de données (IA) réajustent leur charge à 50-100 MW et auront besoin de transformateurs conçus pour des hautes tensions et personnalisés. Aucune prévision n'a inclus la demande, car elle n'existait pas avant 2021.
- Transformateurs intelligents et numériques. Les équipements basés sur l'IoT, les transformateurs à état solide et les contrôles de réseau adaptatifs ont commencé à passer des projets pilotes aux spécifications principalement en Europe et en Amérique du Nord.
- Conception écologique. Les transformateurs à sec et à huile d'esters se développent plus rapidement que le reste du marché en raison des réglementations de sécurité incendie et environnementales dans les bâtiments et les centres de données.
Ainsi, en termes d'approvisionnement, il est préférable d'acheter l'équipement aujourd'hui qui est inconditionnellement adapté à la modernisation avec une surveillance numérique à l'avenir et à la production de solutions plus intelligentes pour les turbines demain.
Dynamique des prix et contrainte d'approvisionnement
L'image des prix est essentielle pour comprendre les développements réels du marché dans ce secteur. Entre 2020 et maintenant, les prix moyens des transformateurs ont augmenté de 60-80%, les délais de livraison aux États-Unis ont dépassé 100 semaines, tandis que les prix rapportés sont jusqu'à quatre fois leur niveau de 2020 pour certains produits. L'acier électrique orienté grain a doublé et les prix du cuivre ont augmenté de 50%, les fournisseurs étant en mesure d'appliquer des augmentations de prix en raison du manque de capacités. Cela explique pourquoi la croissance des prix peut être trompeuse pour la croissance réelle en unités physiques (6.6-7.2% CAGR).
| Produit | Prix 2024 (FOB Chine) | Délai de livraison |
|---|---|---|
| Distribution à huile immergée de 100 kVA | $2,500-$5,000 | 8-20 semaines |
| distribution de 1 000 kVA | $15,000-$30,000 | 10-20 semaines |
| 2,000-2,500 kVA transformateur élévateur renouvelable | $20,000-$45,000 | 10-24 semaines |
| 10-40 MVA puissance moyenne | $80,000-$250,000 | 6-18 mois |
| Transformateur de puissance de 40-500 MVA | $500,000-$4,000,000 | 5-4 ans |
En raison des différentes spécifications, marques et zones de distribution, les prix peuvent différer, cependant, le message fondamental reste le même : ce que nous avons dans ce produit de classe distribution est qu'il peut être obtenu auprès de fournisseurs de milieu de gamme à de bons moments, mais la capacité des transformateurs de puissance est parmi les moyens industriels les plus rares au monde.
Ce que le modèle signifie pour les acheteurs
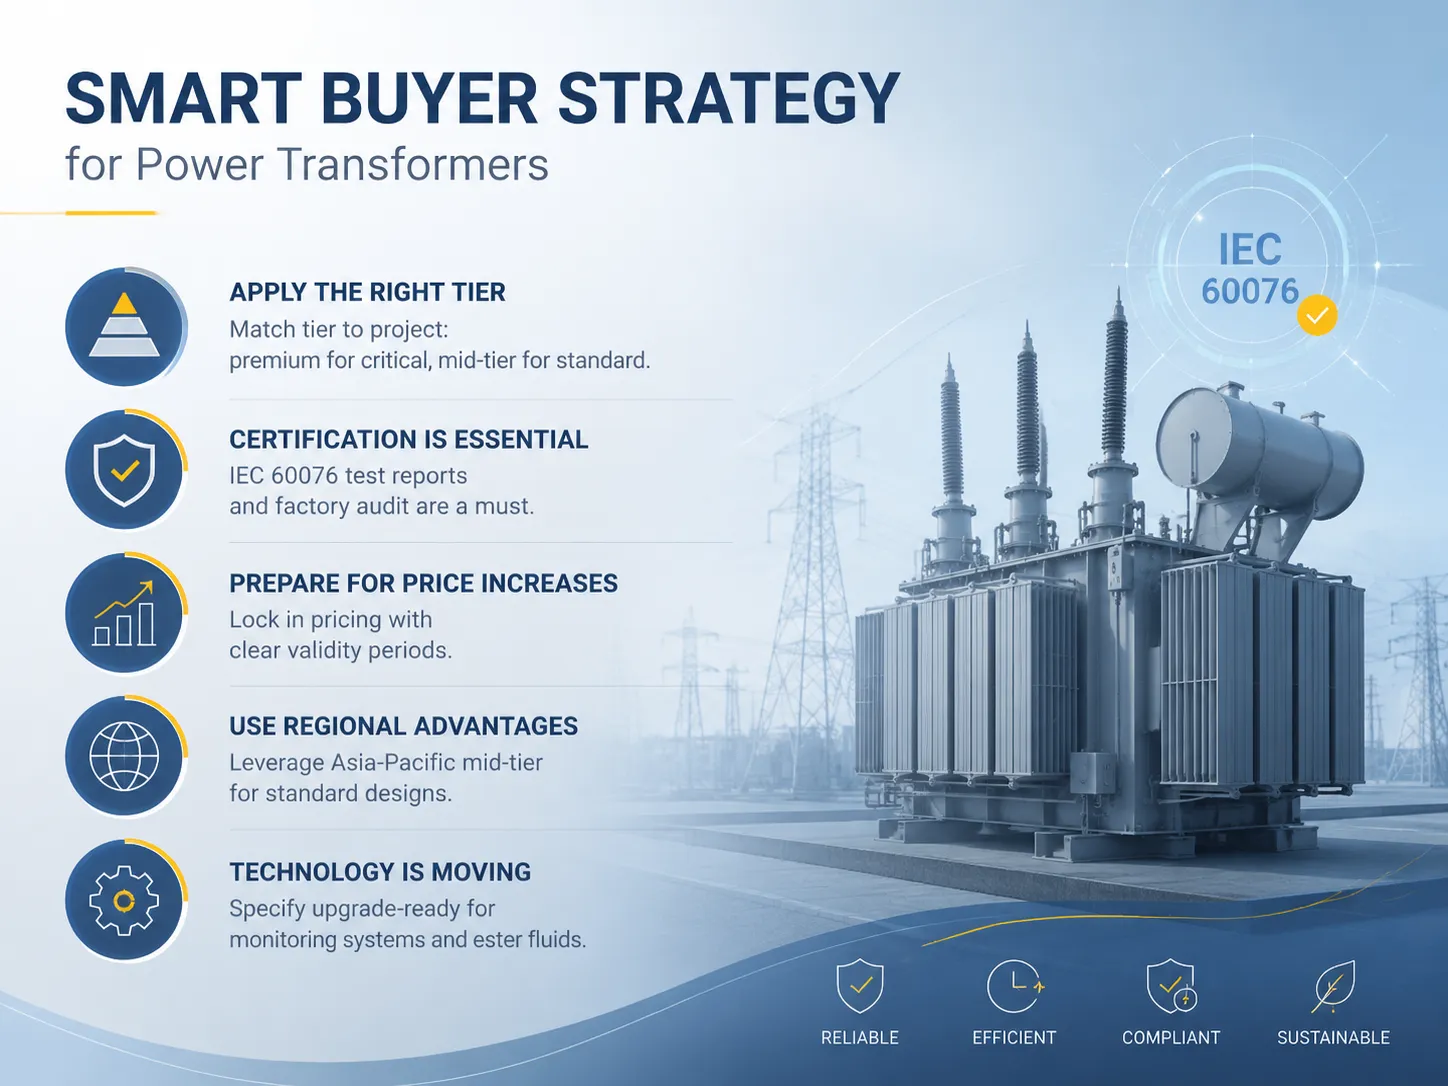
Connaître le paysage concurrentiel peut améliorer vos décisions d'achat :
- Appliquez le bon niveau au projet. Les capacités d'ingénierie du niveau premium doivent être utilisées lors de la gestion des infrastructures critiques classées 400kV et plus, tandis que les fabricants de niveau intermédiaire peuvent être choisis pour la transmission d'énergie et les installations de classe inférieure car ils offrent une combinaison appropriée de prix/certification/délai de livraison.
- N'oubliez pas que la certification est un moyen d'accéder au processus plutôt qu'un choix. En cas de pénurie de capacités, la vérification n'est pas un bonus mais plutôt une nécessité. Assurez-vous de demander des rapports d'essai conformément aux normes IEC 60076 et de réaliser un audit d'usine pour vérifier le carnet de commandes et les contrats de matériaux des entreprises.
- Préparez-vous à des augmentations de prix. Signez des contrats avec des périodes de prix spécifiques pour éviter les conséquences de la situation actuelle sur les marchés.
- Utilisez les avantages régionaux. Les entreprises de la région Asie-Pacifique, en particulier les producteurs chinois de niveau intermédiaire, ont de nombreuses opportunités et pourraient être utilisées pour des conceptions standard, tandis que le niveau premium devrait être réservé uniquement aux conceptions spéciales.
- Gardez à l'esprit que la technologie est en mouvement. Précisez que les transformateurs doivent pouvoir être mis à niveau pour utiliser des systèmes de surveillance et des fluides esters.
L'opportunité de niveau intermédiaire
Le segment concurrentiel qui émerge entre les entreprises mondiales et les géants nationaux tend à inclure la plupart des transactions d'aujourd'hui dans le domaine des clients internationaux, représenté par les fabricants de niveau intermédiaire certifiés par l'IEC, qui offrent des transformateurs de distribution ainsi que des transformateurs de puissance moyenne, tout en fournissant une performance rapide. Cela se voit bien dans l'exemple de Jiangsu Subian Electric Power, un fabricant chinois de transformateurs certifié selon l'IEC 60076, traitant des transformateurs immergés dans l'huile et des transformateurs à sec fabriqués pour des entreprises de services publics, des développeurs d'énergie renouvelable et des clients industriels en Asie, en Afrique, au Moyen-Orient et en Amérique latine, avec des délais de livraison réguliers de 8 à 16 semaines et des données de test complètes.
Cela rend ce niveau d'opération une niche très attrayante pour le marché. Étant donné que les producteurs de niveau 1 font face à des arriérés de plusieurs années et que les entreprises de niveau 2 se concentrent davantage sur les développements nationaux et la production de très haute tension, il est dans le meilleur intérêt des fabricants de niveau intermédiaire de pouvoir livrer des produits selon les spécifications de leurs clients.
Questions Fréquemment Posées
Quelle est la taille du marché mondial des transformateurs ?
La valeur estimée pour l'année 2024 varie de $45 à $64 milliards selon la méthode utilisée. Selon Global Market Insights, le chiffre s'élève à $63,8 milliards. Selon les prévisions générales, la période 2024-2034 est caractérisée par un TCAC de 6,6-7,2% et le chiffre d'affaires total devrait atteindre environ $100-122 milliards d'ici l'année 2034. Il convient de mentionner que la part des transformateurs de distribution représente 52% du chiffre d'affaires total et que la part des transformateurs de puissance est d'environ 40%.
Qui sont les plus grands fabricants de transformateurs ?
Hitachi Energy est le plus grand au monde, suivi par Siemens Energy, GE Vernova, Schneider Electric, Toshiba Energy Systems et Mitsubishi Electric dans la catégorie supérieure. TBEA, China XD Group et Baoding Tianwei dominent le segment en volume. Les cinq premières entreprises contrôlent presque 40% du marché, démontrant un niveau élevé de concentration dans le segment premium.
Quelle région a le plus grand marché des transformateurs ?
L'Asie-Pacifique représente plus de 50% de la demande mondiale en énergie renouvelable, principalement en raison des expansions de réseau en Chine et en Inde. En Amérique du Nord, la demande est d'environ 22% et en Europe autour de 20%. Le Moyen-Orient, l'Afrique et l'Amérique latine ont connu une croissance en tant que marchés d'importation, mais les installations de fabrication dans ces régions sont restées limitées.
Pourquoi les prix des transformateurs et les délais de livraison sont-ils si élevés ?
Depuis 2020, les prix ont augmenté de 60 à 80% en raison du doublement des prix de l'acier électrique orienté grain, de l'augmentation d'environ 50% du prix du cuivre et de la hausse de la demande de l'industrie des énergies renouvelables, des centres de données AI et de la modernisation des réseaux électriques qui ont largement dépassé l'offre. Les délais de livraison moyens ont dépassé 100 semaines, tandis que pour les énormes transformateurs de puissance, ils varient de 1,5 à 4 ans en raison de la nature concentrée et capitalistique de l'industrie et de la lente croissance de ses capacités de production.
Dois-je acheter auprès d'une marque mondiale ou d'un fabricant chinois ?
Il est nécessaire d'adapter la classe au projet. Les fabricants d'équipements d'origine avec des réseaux d'ingénierie et de service premium sont justifiés dans tout retard encouru avec des lignes de vie haute tension. Pour les transformateurs de moyenne tension et ceux destinés à la distribution d'énergie, les fabricants chinois de niveau intermédiaire certifiés IEC semblent offrir la meilleure combinaison de prix, de certification et de délais de livraison de 8 à 16 semaines. Assurez-vous toujours de consulter les rapports d'essai de type et d'auditer l'usine à l'avance.
Références
- Global Market Insights – Rapport sur le marché des transformateurs – Source de la taille du marché de $63,8 milliards en 2024, 6,6% de CAGR, et prévision de $122,7 milliards en 2034.
- IEA Électricité 2024 – Analyse des besoins d'investissement dans les réseaux et de la demande d'équipement stimulant la croissance du marché des transformateurs.
- Département de l'Énergie des États-Unis – Stratégie de chaîne d'approvisionnement – Évaluation par le gouvernement américain de la capacité domestique des transformateurs et de la dépendance aux importations.
- Wood Mackenzie – Recherche sur la chaîne d'approvisionnement concernant les délais de livraison des transformateurs, les prix et les délais d'expansion de capacité.
- IEC 60076-1 : Transformateurs de puissance – Général – La norme internationale régissant les essais de type de transformateur et l'exigence clé de certification pour les exportateurs.
- Siemens Energy – Source d'entreprise pour les données sur le vieillissement de la flotte et les investissements en capacité de transformateurs de grande puissance en Amérique du Nord et en Europe.
- Jiangsu Subian Electric Power – Fabricant de transformateurs de distribution et de puissance moyenne certifié IEC 60076 pour les acheteurs internationaux.
Conclusion
L'industrie internationale des transformateurs représente un montant de $55-64 milliards, avec une croissance annuelle croissante de 6,6-7,2% de CAGR et une domination des transformateurs de distribution, principalement déclenchée par la demande dans la région Asie-Pacifique. Le marché peut être divisé en trois niveaux concurrentiels offrant différentes propositions de valeur : le niveau premium, qui est hautement consolidé et réservé pour les années à venir ; le niveau volume, qui répond à la demande mondiale de transformateurs ; et le niveau intermédiaire, où les achats peuvent être effectués par les acheteurs ayant un calendrier ferme pour la mise en œuvre et des spécifications de réalisation technique disponibles.
La leçon de la recherche est la nécessité de s'assurer que le niveau du fournisseur correspond à la criticité du développement, ainsi que de vérifier si le transformateur est conforme à la certification IEC 60076 pour rendre le processus d'achat non négociable. De plus, il est nécessaire d'être prêt à une escalade des prix et à une flexibilité géographique possible.