


In sintesi, lo studio più citato/conosciuto dal Dipartimento dell'Energia degli Stati Uniti su questo argomento ha concluso che un'adozione più rapida dei veicoli elettrici richiederà un po' più di investimento nelle reti elettriche locali, ma molto meno di quanto si pensi, e ha anche indicato che un utilizzo intelligente dell'energia elettrica può aiutare a risparmiare 30% di questo investimento. Nello studio che copre cinque stati, gli autori hanno stimato un costo di circa $2,3 miliardi con la ricarica non gestita e $1,6 miliardi con quella gestita in spese di distribuzione dal 2027 al 2032. Questo equivale a circa 3% di tutto il denaro speso dalle aziende di servizi pubblici in quegli stati per la distribuzione nel periodo di tempo indicato.
La ricerca non è né una regolamentazione né significa che ciascuna delle stazioni di ricarica debba installare un nuovo trasformatore. Lo studio fornisce un modello dettagliato della distribuzione del carico elettrico e dell'espansione necessaria dell'attrezzatura per questo scopo. Questo documento abbraccia tutti gli aspetti fondamentali che si dovrebbero considerare quando si stima se i punti di ricarica e le sottostazioni necessitano di aggiornamenti come parte del programma di ricarica EV del DOE.
Per quanto riguarda l'indipendenza, Subian Electric è un'azienda manifatturiera specializzata nella produzione di trasformatori e sottostazioni. Non c'è alcun collegamento tra noi e il Dipartimento dell'Energia e tutti i risultati della ricerca del DOE non possono essere interpretati come un'approvazione di alcuna azienda o dei suoi prodotti, compresi i nostri.
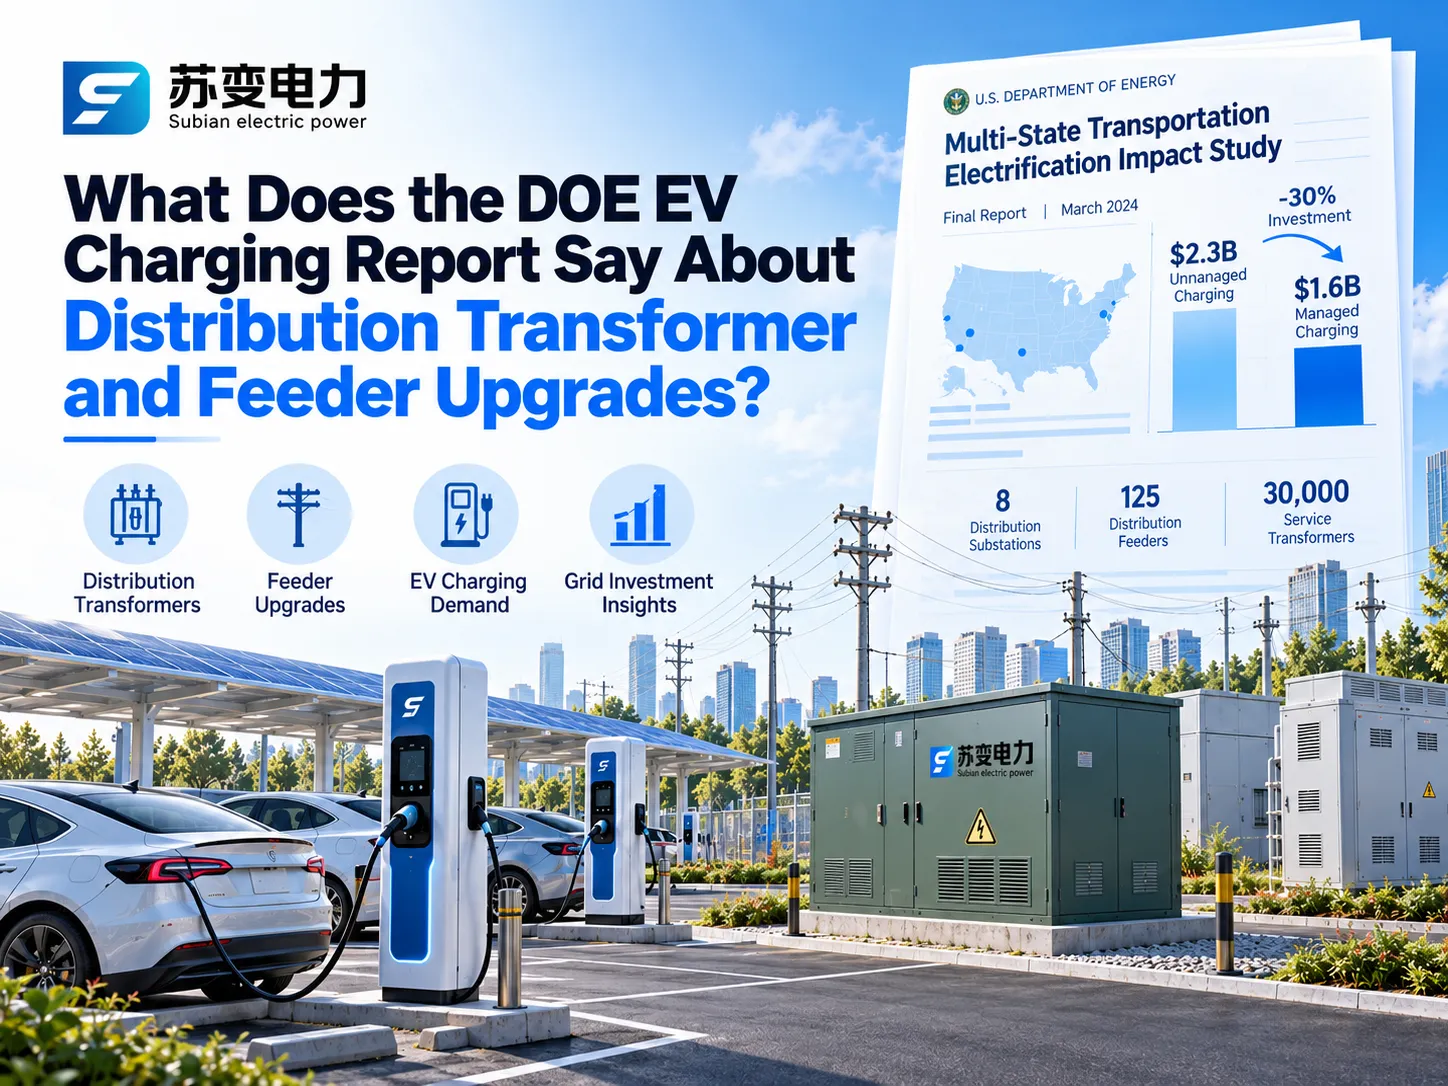
Cosa ha effettivamente trovato il Rapporto di Aggiornamento della Distribuzione della Ricarica EV del DOE
Chi ha condotto lo studio e cosa ha modellato
Il rapporto dello Studio sull'Impatto dell'Elettrificazione dei Trasporti Multi-Stato, comunemente abbreviato come TEIS, è stato pubblicato nel mese di marzo 2024 ed è stato prodotto dal National Renewable Energy Laboratory, dal Lawrence Berkeley National Laboratory e dalla società di analisi della rete Kevala con l'assistenza del DOE. I ricercatori hanno modellato la domanda a livello di pacchetto per l'elettricità nelle reti di distribuzione in California, Illinois, New York, Oklahoma e Pennsylvania scelte per le loro varie combinazioni di spazi urbani e rurali, design delle reti, tecnologie di trasporto merci e politiche relative ai veicoli elettrici.
Gli autori hanno confrontato due situazioni future per l'anno 2027 e un'altra situazione abbastanza simile nell'anno 2032. Cioè, nello scenario di Azione, il piano di elettrificazione dei veicoli procede attraverso una delle opzioni di conformità ai requisiti federali sulle emissioni dei veicoli considerati nel 2023 per avere 55 milioni di veicoli elettrici installati entro il 2032. Lo scenario di Nessuna Azione porta a installazioni meno efficaci di veicoli, cioè 41 milioni di veicoli. Negli cinque stati analizzati, i numeri totali di veicoli sono 20 milioni e 16 milioni rispettivamente, il che implica una differenza di 3,9 milioni. Entrambi gli scenari sono stati sviluppati con tecnologia di ricarica non gestita, il che significa che i veicoli ricevono elettricità a carica completa subito dopo essere stati collegati.
I Numeri Principali
Tutte le cifre di seguito sono incrementali, il che significa la differenza tra gli scenari di Azione e Nessuna Azione, e sono in dollari del 2023.
| Risultato | Risultato dei cinque stati |
|---|---|
| Investimento incrementale nella rete di distribuzione, ricarica non gestita (2027–2032) | Circa $2,3 miliardi |
| Investimento incrementale nella rete di distribuzione, ricarica gestita | Circa $1,6 miliardi (30 percento in meno) |
| Quota dell'attuale investimento annuale nella distribuzione nei cinque stati | Circa 3 percento |
| Attività incrementali della rete, ricarica non gestita | 8 sottostazioni di distribuzione, 125 feeder e 30.000 trasformatori di servizio |
| Riduzione delle necessità di asset con ricarica gestita | Sottostazioni circa 50 percento, feeder circa 40 percento, trasformatori di servizio circa 30 percento |
| Porte di ricarica incrementali necessarie entro il 2032 | 2,3 milioni, di cui il 97 percento sono porte AC |
| Investimento combinato in ricarica e rete | $12,0 miliardi, di cui $9,7 miliardi è attrezzatura di ricarica e $2,3 miliardi è aggiornamenti della rete |
| Beneficio netto per i consumatori nel ciclo di vita dei veicoli incrementali | $33 miliardi, più di 2,5 volte l'investimento in infrastrutture |
Ci sono due punti più sottili che potrebbero non essere immediatamente apprezzati. Il primo è rappresentato dalla situazione studiata nel rapporto con campi di sottostazioni, banchi di trasformatori e trasformatori di servizio che terminano le operazioni di costruzione nel 2027 per colmare il divario di domanda del 2032 e che gli aggiornamenti dei feeder sono ancora in corso nel 2032. Pertanto, si può vedere che i feeder rimangono il problema qui. Il secondo punto importante è che il costo è aumentato a gradi simili anche in stati molto diversi: nello scenario non gestito, il costo della distribuzione dell'energia aumenterà del 3,3-4,3 percento entro il 2032.
Cosa non ti dice il rapporto
È altrettanto importante interpretare correttamente queste cifre quanto citarle accuratamente. La ricerca si è concentrata solo su sottostazioni, feeder, trasformatori e linee di distribuzione. Pertanto, i costi di generazione e trasmissione non sono stati considerati. I cinque stati creano una buona comprensione ma non rappresentano tutte le circostanze in tutte le utility. La modellazione ha incluso solo la ricarica domestica e dei depositi di flotta, ignorando altri carichi non EV sugli stessi circuiti, gli autori definiscono i risparmi conservativi. Lo studio non assegna costi di rete agli utenti EV o ad altri clienti che utilizzano la stessa capacità.
Come lo studio ha deciso quando un trasformatore, un feeder o una sottostazione necessita di un aggiornamento
Le informazioni che hanno la massima applicazione per gli ingegneri nel rapporto si basano non sul costo menzionato nel titolo ma sul modo in cui tale costo è stato calcolato. Kevala è stata in grado di calcolare il carico di picco orario su ogni livello della rete e definire alcune regole chiare che mostrano quando un'attrezzatura è sovraccaricata e cosa può essere utilizzato come sostituto.
| Livello della rete | Test di sovraccarico utilizzato nello studio | Fissazione modellata |
|---|---|---|
| Sottostazione di distribuzione | Carico di picco superiore al 100 percento della capacità | Aggiungere un banco di trasformatori da 30 MW a sottostazioni sotto i 100 MW, o un banco del 35 percento della capacità per quelle più grandi; se ancora sovraccaricato, costruire una nuova sottostazione, tipicamente 60 MW |
| Alimentatore | Carico di picco superiore al 100 percento della capacità termica | Trasferire prima il carico ai feeder vicini dove possibile; altrimenti aggiungere un nuovo feeder di circa 11 MW (fino a 15 kV), 24 MW (16-25 kV) o 30 MW (26-35 kV) |
| Trasformatori di servizio | Picco aggregato di tutti i trasformatori di servizio su un feeder superiore al 125 percento della loro potenza combinata, escludendo la ricarica rapida in DC | Aggiungere trasformatori di servizio da 50 kW per coprire il carico extra |
| Siti di ricarica rapida in DC | Ogni sito con ricarica rapida in DC | Un trasformatore di servizio dedicato trifase dimensionato in base alla potenza del caricatore, al numero di porte e a un fattore di diversità |
Il documento di ricerca ha anche dettagliato i costi dei componenti. Per la California 2032, il costo medio pubblicato per costruire nuove sottostazioni era di circa $30 milioni, $10 milioni per la costruzione di un nuovo banco di trasformatori di sottostazione, circa $611.000 per la costruzione di un nuovo feeder, approssimativamente $20.000 per un trasformatore di servizio di tipo convenzionale e $50.000 per un trasformatore di servizio dedicato a un centro di ricarica rapida. Sebbene questi siano costi previsti, danno un'idea di quanto rapidamente stiano aumentando i costi. Il tempo segue lo stesso schema. Riferendosi ad altre ricerche, il rapporto afferma che un progetto di ricarica della durata di 3-10 mesi può guadagnare un anno se deve aggiornare il suo feeder e fino a 4 anni per un aggiornamento della sottostazione.
Gli effetti della ricarica dei veicoli elettrici su ciascun strato della rete di distribuzione elettrica
The electrical distribution network has three distinct levels and EV charging creates different forms of disruption in each one. The most valuable information for planning purposes is to know which of these levels is the bottleneck, as responses differ for each of them.
Failures of the Service Transformer
The service transformer refers to the unit mounted at either the top of a pole or resting on the ground. Its main responsibility is to transform voltage from a medium level to a low one that can be used by customers of a given community including homes or car stations. The service transformer usually serves several customers, up to about a dozen, and hence becomes the first one to encounter the issue of clustered charging stations. The transformer is based on the need to meet the demands of all residents of a community living in homes; but this solves little in case several stations of 7-11 kW power pull the trigger at the same time.
Feeder Thermal Constraints
A feeder is the medium-rated voltage circuit which usually has 12.47 KV, 13.2 KV or 24.9 KV in North America and 10, 11, 20 or 33 KV in other countries. It can run out of capacity either when its load reaches the thermal limit or when the level of voltage on the load side changes dramatically. The triggers typically include fast charging hubs, truck depots and other places of charging where one charging station consumes more power than a whole area of residential buildings.
Substation Capacity Limitations
A substation consists of two or four transformer banks. Substation operations are the least likely to be undermined by extensive home charging; however, this is one of the most expensive and time-consuming processes of upgrades.
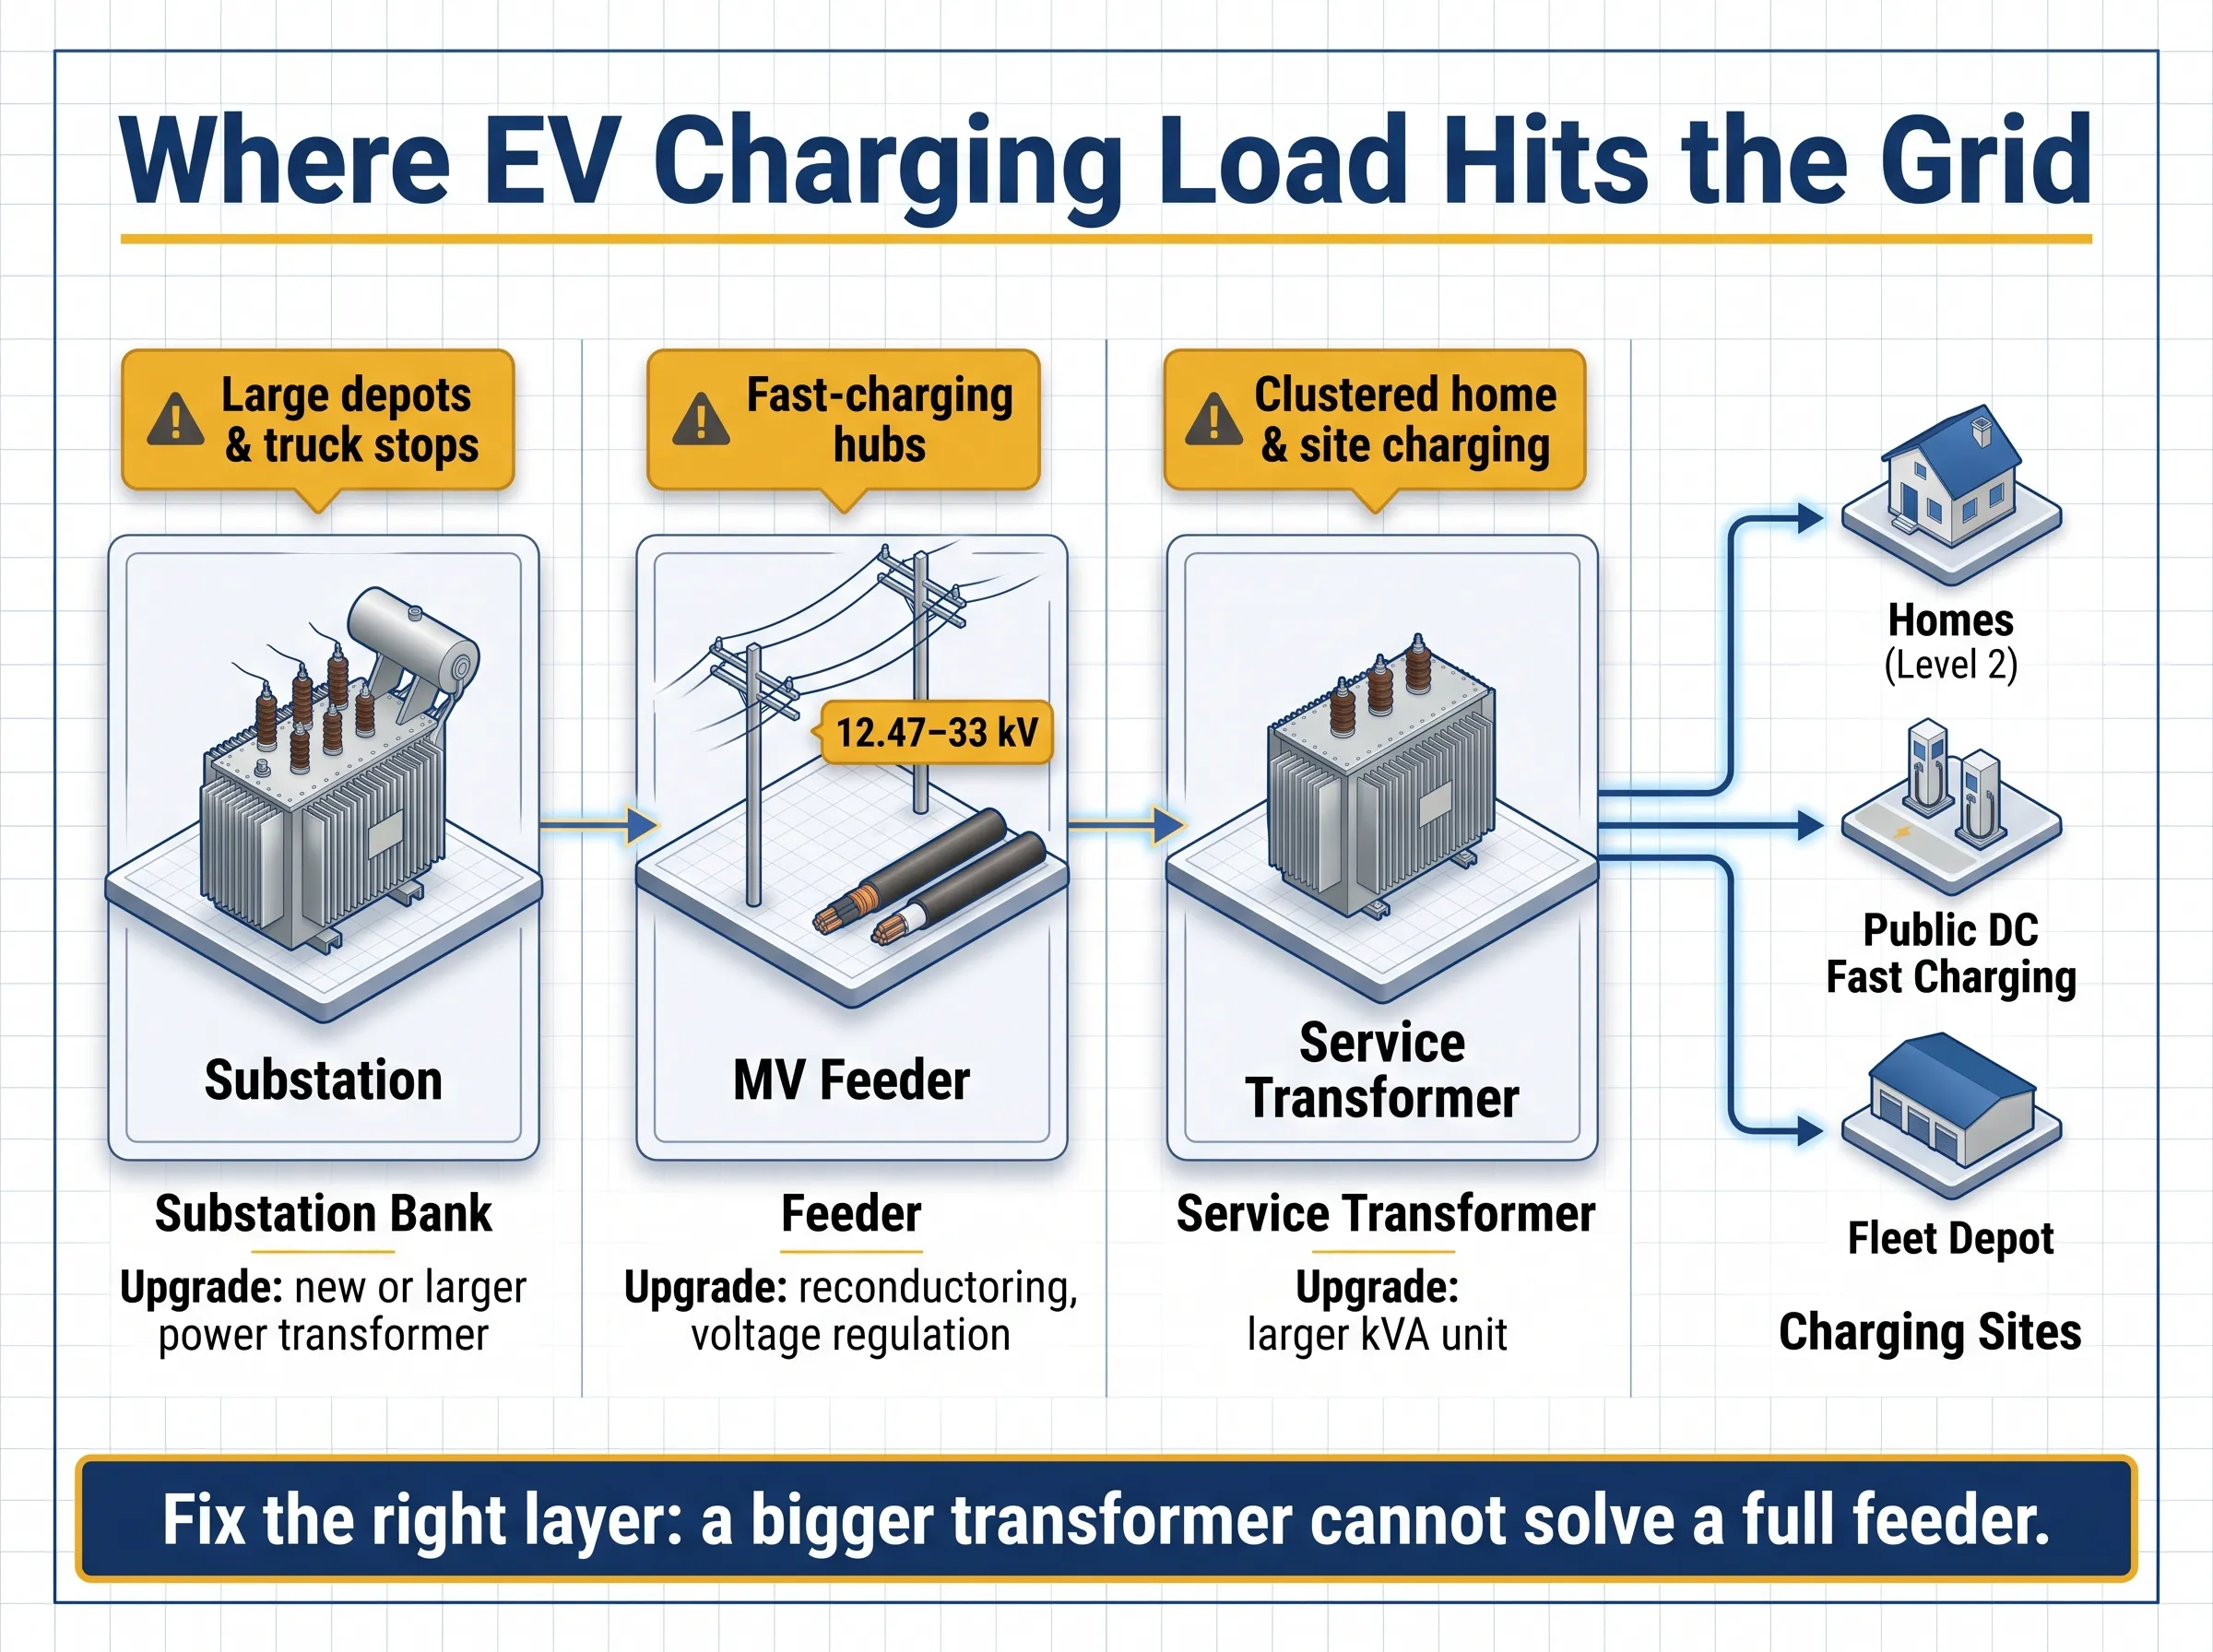
How EV Charging Load Differs by Site Type
The same amount of energy can be easy or hard for the grid to deliver depending on how concentrated it is and when it arrives. The TEIS appendix estimates the distribution upgrade cost attributable to each type of charger, which gives a useful sense of scale.
| Site type | Typical charger power | First pressure point | Modeled grid upgrade cost per charger, 2032, unmanaged / managed |
|---|---|---|---|
| Single-family home, Level 2 | 7 to 11 kW | Shared street transformer | About $1,500 / $1,300 |
| Workplace, Level 2 | 7 to 19 kW | Building or site transformer | About $5,000 / $5,200 |
| Public fast charging, light-duty, 150 kW | 150 kW | Dedicated site transformer, sometimes the feeder | About $29,700 / $27,400 |
| Public fast charging, light-duty, 250 kW | 250 kW | Dedicated site transformer and feeder | About $48,700 / $44,200 |
| Truck depot, 150 kW DC | 150 kW | Feeder and sometimes substation | About $47,100 / $38,000 |
| Public heavy-duty charging, 1.5 MW | 1.5 MW | Feeder and substation | About $256,600 / $187,400 |
Two notable trends emerge. The price per charger increases substantially with power, and managed charging has the highest advantage when vehicles remain parked for long periods of time, such as depots, while making almost no impact at workplaces with a steady load throughout the day. This confirms the study’s major finding that the greatest savings to the grid derive from residential spaces and fleet depots where charging can be scheduled without inconveniencing the driver.
How to Size a Distribution Transformer for DC Fast Charging
Many projects either oversize their transformer or undersize it. Oversizing occurs when the nameplate ratings for every charger are summed to calculate the size leading to wastage of capital, while ignoring losses and the coincidence of chargers sizing results in undersizing. Proper sizing of DC fast charging transformers occurs between these two extremes since it relies on clearly defined assumptions.
Charger Nameplate vs Real Grid Demand
Normally a charger will be rated for DC output. But since the grid must supply that output along with conversion losses, the AC input must be greater in value than the DC rating. In addition, not all chargers deliver their full power at any time as vehicles come at different levels of charge and charging power is reduced when the battery is filled. A lot of the sites also have a system-level limit and share power among the dispensers.
Diversity Factors Used in the DOE Study
The TEIS team sized each fast-charging site’s dedicated transformer by multiplying charger power and port count by a diversity factor that depends on charger size, vehicle class and the number of ports. For light-duty sites, the factors were:
| Charger power per port | Up to 3 ports | 4 to 8 ports | More than 8 ports |
|---|---|---|---|
| 50 kW | 1.0 | 1.0 | 1.0 |
| 150 kW | 1.0 | 1.0 | 0.5 |
| 350 kW | 1.0 | 0.75 | 0.5 |
| 500 kW | 1.0 | 0.75 | 0.5 |
It was assumed that small sites would operate at full capacity, while diversity only came into play on larger sites with high-capacity charger installations. The considerations are only assumptions in modeling, but they are a good verification tool to validate one’s own calculations. In the USA, article 625 of NEC puts EV chargers into the category of continuous loads and that affects the rating of both customer-side conductors and protective devices.
Worked Example: Eight 180 kW DC Fast Chargers
Consider a public hub with eight 180 kW DC chargers. Assume a 70 percent coincidence factor enforced by the site’s load management, 95 percent charger efficiency, a 0.98 input power factor and a 15 percent design margin for growth and auxiliary loads such as lighting, cooling and payment systems.
| Passo | Calcolo | Risultato |
|---|---|---|
| Coincident DC output | 8 × 180 kW × 0.70 | 1,008 kW |
| AC input power | 1,008 kW ÷ 0.95 | About 1,061 kW |
| Potenza apparente | 1,061 kW ÷ 0.98 | About 1,083 kVA |
| With 15 percent margin | 1,083 kVA × 1.15 | About 1,245 kVA |
| Next standard size, IEC practice | Round up | 1,250 kVA |
| Next standard size, North American three-phase pad-mount | Common ANSI ratings step from 1,000 to 1,500 kVA | 1,500 kVA |
The factor of coincidence determines the parameters of the project more than anything else. If the site is run at the loading of 50%, the value will be about 889 kVA, which would require the supply of 1,000 kVA of capacity, regardless of the system. In the case of running the site under load at 100% and without load management, the required capacity is about 1,779 kVA, which would call for 2,000 kVA. This influence is the reason why load management should be determined first, rather than done after ordering the transformer. Remember that this example is just an example, not a design – real project includes the measurement of harmonics of the chargers’ power electronics, transformer impedance, and levels of short-circuit currents, ambient temperature, and electric utility regulations.
When Is a Feeder Upgrade Needed Instead of a Bigger Transformer?
A larger transformer can be useful at a site but it will not solve issues concerning an already overloaded feeder. This is a point that often confuses people as the developer owns the transformer while the utility has the control over the feeder.
An upgrade to the electrical system for electric vehicle charging will be necessary if the following three issues occur: the new load increases the electric load that the feeder can carry; voltage levels at the end of the circuit are beyond the legal limits; or according to the utility’s hosting capacity study or interconnection study, the circuit cannot accommodate the new load without any negative effect on other consumers. As for the approach taken by the Department of Energy that pioneered the idea, the utility’s representatives focused on shifting loads to the feeder that has enough capacity before they even think about building the new circuits.
Thus, one of the lessons for developers is inescapable: work on feeders usually requires more time and costs more in comparison to switching transformers, and sometimes even means that new digging or overhead work needs to be carried out on a site. There is also an idea to get in touch with the utility in advance to check on the loading capacity before making a decision to make a purchase.
Is it Possible for Managed Charging and Battery Storage To Delay Grid Improvements?
Yes, usually, and that is the main finding from the study carried out by the Department of Energy. Managed charging is meant to transfer or redistribute loads from other power sources so that existing infrastructure is able to handle the loads required. Research has indicated that managed charging can allow for a reduction in the peak electric load due to electric vehicles by about thirty percent and contribute to the need for construction of new substations, feeders, and transformers by about fifty percent, forty percent, and thirty percent respectively.
Time-of-Use Pricing and Dynamic Load Management
The most basic approach is the so-called time-of-use pricing, which means that users are incentivized to charge vehicles after the peak period in the evening. More advanced approaches allow for dynamic load management, which permits power management in real time by limiting the load in terms of performance of various charging points. In this instance, modified software can allow for effective use of transformers by distributing workload over time and limiting the total load on transformers.
Flexible Connection to the Grid
An upcoming method is the so-called flexible connection to the grid (first introduced in a paper published in 2024 by the Office of Electrical Power of the Department of Energy). This approach permits connections to charging stations before construction of facilities is completed, based on the condition that electrical charge of the facilities is reduced in fixed situations of overload. Several Californian and some northeastern states have piloted this approach and connected the electrical loading for public charging on the charging vehicle stations.
Battery Storage for Peak Shaving
A battery energy storage system is put into use at the charging station where it receives charging exposure from the grid at a slow pace when traffic is low and vice-versa where it actually discharges when activity is heavy. This enables the station to offer more power than the grid itself allows. Energy storage is useful in the locations where peak periods are short and predictable. A battery energy storage system adds its own components like a power conversion unit, devices for protection, etc. Our guide to the sottostazione compatta per accumulo energetico explains how the PCS, transformer and medium-voltage switchgear fit together in these projects.
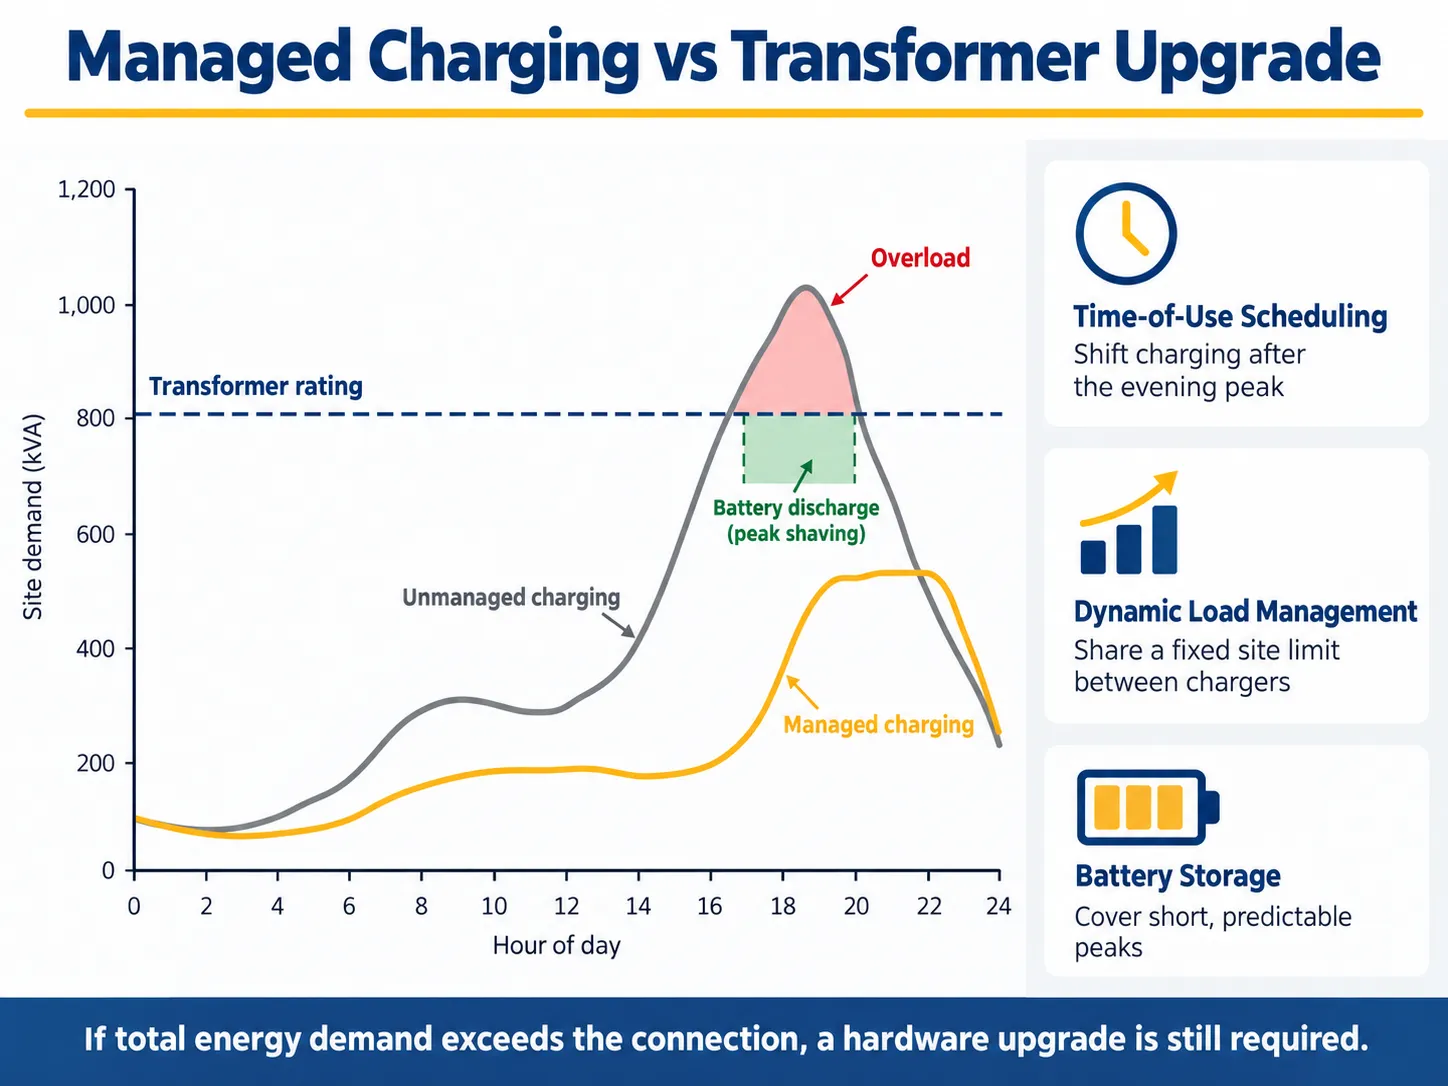
When Hardware Upgrades Are Still Unavoidable
Management has limitations. If a facility has a set energy requirement each night, scheduling may help reduce the peak load but won’t lower the total consumption. Charging a battery is not possible if the load already exceeds the supply capacity since the battery can’t recharge. There is limited flexibility for a DC fast charging station that needs to serve any vehicles arriving at that time. Results from the US Department of Energy show that managed charging is not effective. In Oklahoma, where the demand peaks in the morning, postponing charging at night did not ease the situation. In this case, installing a well-sized transformer at the charging location or doing some work on the feeder is the only practical solution.
Choosing the Equipment: Pad-Mounted, Dry-Type or Prefabricated Substation
Pad-Mounted Transformers for Public Charging Sites
In the majority of outdoor charging locations, three-phase pad-mounted transformers are used as standard equipment. Such transformers are mounted on a concrete slab and have a protected enclosure so they can be put near the charging points. Important settings for selection include input voltage, loop or radial power supply, connection configuration, resistance, and effectiveness. Subian Electric manufactures three-phase pad-mounted transformers configured to each project’s network voltage and standard.
Dry-Type Transformers for Indoor and Parking Structures
In instances where invigilators are installed within the underground parking areas, underground garages, or buildings, the fire safety regulations would generally prefer isolation transformers. Hence, the most common option would be cast resin dry type transformers that do not need an oil tank at all and need minimal servicing. Subian’s gamma di trasformatori a secco includes epoxy-resin cast units for these installations.
Prefabricated Substations for Large Charging Hubs
Medium-voltage switchgear, one or several transformers and a low-voltage board are usually required at large hubs and bus stations where charging is combined with solar and storage. A prefabricated substation manufactured in a plant provides everything in one tested enclosure and saves a lot of time when working on the site.Our compact substation guide covers how these units are specified. Subian’s Sottostazione prefabbricata serie YB integrates the three sections in one unit, and for 33 kV networks the company also builds 33 kV compact substations.
IEEE C57 vs IEC 60076 and IEC 62271-202
The two main families of standards should not be mixed, because voltages, ratings and test levels differ.
| Voce | North American utility projects | International projects |
|---|---|---|
| Standard di trasformatori | IEEE C57 series, including IEEE C57.12.34 for three-phase pad-mounted units | Serie IEC 60076 |
| Prefabricated substation standard | Utility and customer specifications | IEC 62271-202 |
| Typical distribution voltages | 12.47, 13.2, 24.9 and 34.5 kV | 10, 11, 20, 22 and 33 kV |
| Frequenza | 60 Hz | 50 Hz in most markets, 60 Hz in some |
| Common three-phase ratings around 1 MVA | 750, 1,000, 1,500 kVA | 800, 1,000, 1,250, 1,600 kVA |
| Approval route | Utility specification and approved vendor list | Type test reports and utility or consultant approval |
Subian Electric builds mainly to IEC standards for projects in Asia, Africa, the Middle East and Latin America. North American requirements can be engineered on a project basis, but voltage, insulation level, configuration and utility acceptance must be confirmed at the start of every enquiry.
What Drives Upgrade Costs and Lead Times?
There is a huge variation in implementation costs of charging sites, from very low in cases of present spare capacity to many millions if the expansion of a substation is required. Major factors in the overall costs of charging site implementation are transformer and switchgear itself; installation costs incurred, which usually exceed hardware costs; costs related to utility make-ready and interconnection; and completion of various reinforcement works. It is important to note that the charging cost estimations are based on TEIS documents, which do not take into account utility-side improvements or on-site storage, which is significant, according to the authors.
The person who pays the bill depends on the ownership boundary. Utility practices vary: the utility bears the costs and owns the equipment before the revenue meter (with transformer sometimes included), while the developer pays for everything behind it in some cases. In some other cases, customer is making the purchase of the needed transformer himself. The earlier the boundaries of the costs responsible for the parties at the project are checked, the fewer chances for budget surprises.
Nowadays, time matters as much as money. Demand growing from sources of renewables, data centers, and electrification can lead to expansion of transformers’ lead time in different markets. Therefore, if a project is waiting for the permits to start the process of equipment ordering, it may wait for a considerable period of time. Hence, it is better to choose standard ratings, to make sure the specifications check is done, and to involve more than one qualified manufacturer.
EV Charging Distribution Transformer RFQ Checklist
Whether you are buying a single pad-mounted unit or a complete substation, sending the same clear brief to every supplier makes quotations comparable.
| Categoria | What to specify |
|---|---|
| Classificazioni | Primary and secondary voltage, frequency, rated kVA with the load calculation and coincidence assumption behind it |
| Electrical design | Vector group, impedance, basic insulation level, tap range, harmonic loading from chargers |
| Configurazione | Loop or radial feed, dead-front or live-front, primary protection, LV outgoing feeders |
| Efficiency and construction | Loss limits under local regulations, insulating fluid or dry-type construction |
| Site conditions | Ambient temperature, altitude, corrosion and flood risk, enclosure protection |
| Standards and documents | IEEE C57 or IEC 60076, routine test reports, type test evidence, drawings |
| Commerciale | Delivery time, packing, warranty, commissioning support |
Domande frequenti
What does the DOE EV charging distribution transformer and feeder upgrades report say?
The Multi-State Transportation Electrification Impact Study published in 2024 projected that an additional $2.3 billion distribution investment was required across five states from the year 2027 to the year 2032 with the adoption of unmanaged charging that included 8 substations, 125 feeders and 30,000 service transformers. The amount required to invest in the distribution with managed charging decreased to around $1.6 billion.
Does EV charging always require a transformer upgrade?
No. In most cases, the connections to the home and small sites remain the same. Upgrades may occur where multiple chargers share a single service transformer, where a site implements high-power DC fast charging, or where a fleet depot has numerous vehicles in one location.
What size transformer does a DC fast charging station need?
Charging capacity is determined by the number of chargers, coincidence factor, efficiency as well as power factor. In the example mentioned above, eight 180 kW chargers which have a coincidence of 70 percent require about 1,245 kVA, which amounts to 1,250 kVA as per IEC standard and 1,500 kVA according to standard North American specifications.
Can managed charging avoid a feeder upgrade?
There are times when it happens. The research conducted by DOE proved the reduction of the feeder requirements by approximately 40 percent. Changing or limiting loads helps contain peaks of the load within the feeder’s limits. With versatile connections, some installations can connect before the upgrade is finished, however, an installation with energy demand exceeding the level must be upgraded.
Can battery storage replace a transformer upgrade?
Battery storage can cover short, predictable peaks and let a site deliver more charging power than its connection allows. It cannot replace an upgrade when the site’s average load is already close to or above its grid connection.
Are DOE transformer efficiency standards the same topic?
No. The TEIS document is a grid planning report. The Department of Energy is responsible for the implementation of minimum efficiency standards for distribution transformers sold in the United States through rules issued in 2024 to come into force in 2029. Each is relevant to buyers, however, they are not the same.
Riferimenti
- U.S. Department of Energy: Multi-State Transportation Electrification Impact Study (2024)
- National Renewable Energy Laboratory: Transportation Electrification Impact Study results
- U.S. Department of Energy Office of Electricity: Flexible DER and EV Connections (2024)
- Alternative Fuels Data Center: Procurement and Installation for EV Charging Infrastructure
- Trasformatore di distribuzione, Wikipedia
The DOE research makes one point clear: grids can support large-scale EV charging, provided the right equipment is planned in the right place and load is managed sensibly. When your charging hub, fleet depot or parking project needs a transformer or substation, Jiangsu Subian Electric Power Equipment Co., Ltd. designs and builds pad-mounted and dry-type transformers, prefabricated substations and new energy substations for charging and storage projects, configured to your network voltage and standard. For private-label or distributor supply, see our programma OEM e ODM. Send your charger list, network voltage and site conditions through our pagina di contatto, and our engineers will reply with a sizing check, drawings and a factory quotation.