


~に関して コンテナ型変電所市場, 、過去6年間で大幅な成長を遂げてきました(すなわち、ニッチ製品から一般的な対応へ)が、この製品カテゴリに関する実際の市場調査との関連では顕著な遅れが見られます。2026年に発表された3つのレポートは、それぞれ3つの大手コンサルティング会社からのもので、コンテナ型変電所市場の規模を13億USD、33億USD、35億USDと異なる3つの規模に割り当てています。. これら3つの推定値の差は単なる四捨五入の違いではありません。. したがって、購入者にとってより良い情報は、範囲の違いと総額の推定値の違いを理解することです。.
先の推測を簡単にまとめると、コンテナ型変電所市場の全体規模または価値は2026年に33億USDから35億USDの間と推定されます。予測される 複合年間成長率 は約8.01%であり、この市場は2034年から2036年までに65億USDから79億USDの価値に成長すると見込まれています。予想収益の55%は中電圧セグメントから得られると予想され、最大の収益セグメントは再生可能エネルギーセグメント(全市場収益の46%)からのものとなります。全市場の52%は公益事業セグメントから得られ、最も成長が速い国は中国であり、今後の複合年間成長率は11.5%となります。データセンター需要は2021年のすべての予測で十分に考慮されていませんでした。.
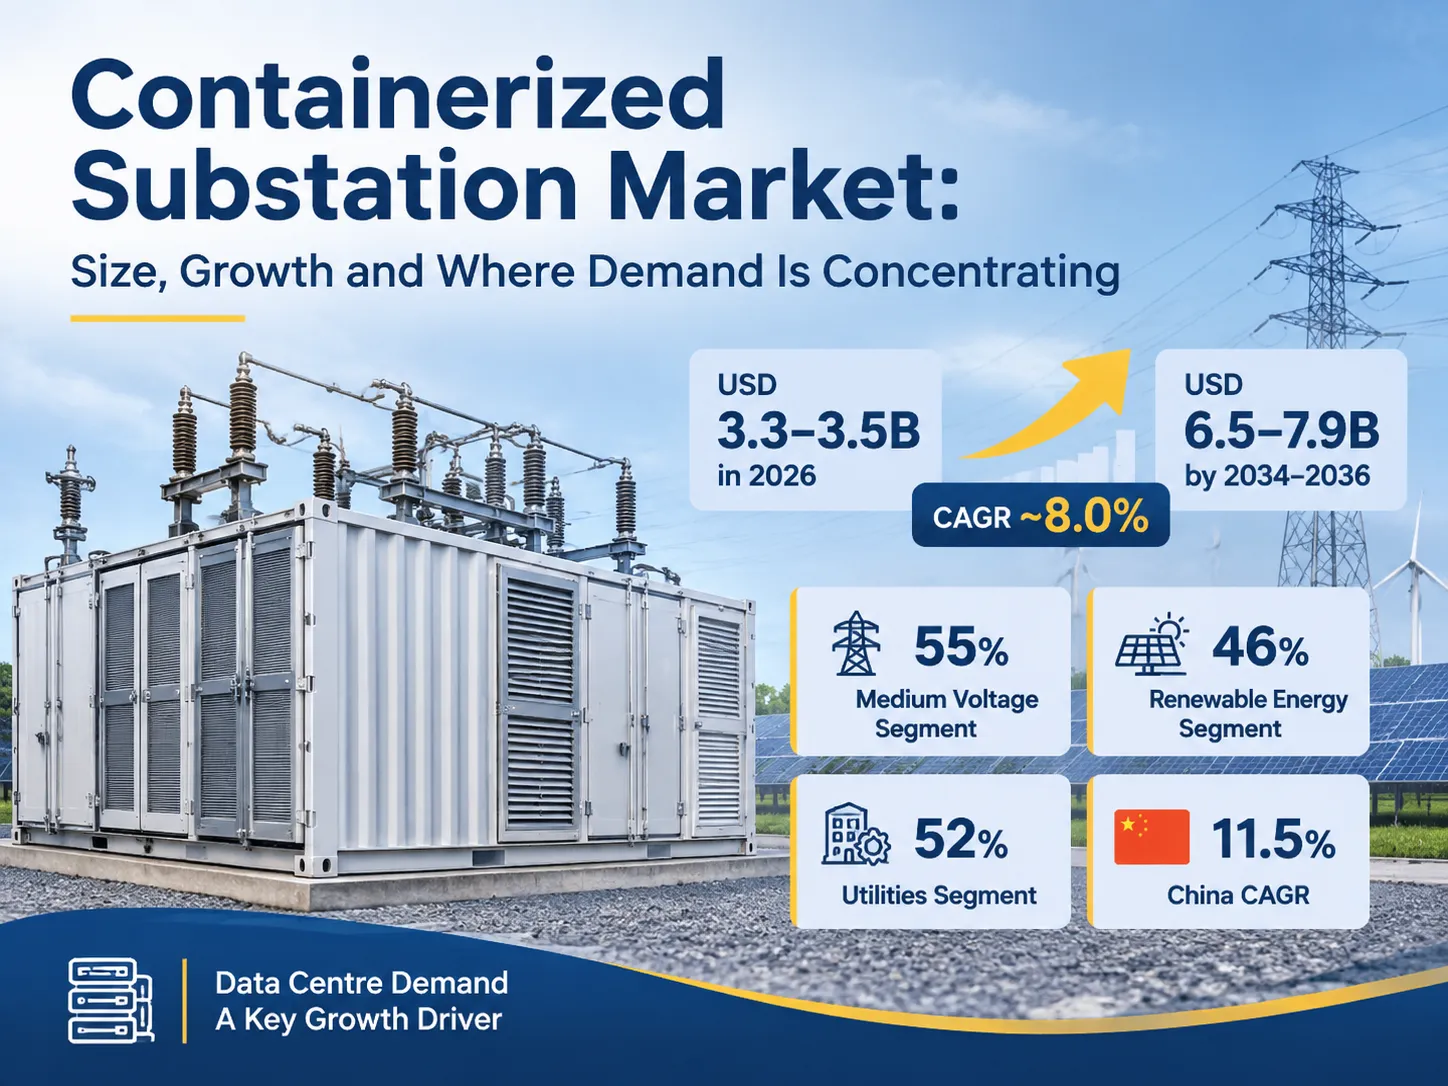
なぜ3つのレポートが3つの異なる数字を示すのか
これまでに発表された3つのレポートはすべて将来の市場成長の予測を提供しています。成長率の予測には一貫性がありますが、市場の絶対規模については意見が分かれています。したがって、3つのレポートはそれぞれ異なる評価方法を使用しています。明らかなのは、新しいグリッド接続を迅速に接続して需要増加を可能にする必要性により、プレハブおよびポータブルなサブ配電変電所の分野で市場成長が継続するということです。以下のグラフに示されています。.
| 出典 | 基準年の価値 | 予測値 | CAGR(複合年間成長率) | 含まれる内容 |
|---|---|---|---|---|
| フューチャーマーケットインサイツ | 32億USD(2025年);34.7億USD(2026年) | 5億USD(2036年) | 8.5% | プレハブポータブルサブ配電変電所市場 |
| ザ・インサイト・パートナーズ | 7億USD(2025年) | 6億USD(2034年) | 8.04% | 同一製品ライン、100MVA以上を含むMVA帯別セグメント |
| リーニン | 2億USD(2025年) | 9億USD(2032年) | 6.7% | より限定的な定義で、スキッド搭載ポータブル変電所に近いもの |
上記に示されたデータから、ポータブルおよびプレハブ型のサブディストリビューションの全体市場は、2025年時点で$3B~$4Bの範囲にあり、市場成長率は約7~9%と一般的に合意されていることがわかります。Reaninの予測は他の2つの報告の約1/3ですが、これはReaninがより大きなプレハブ型ポータブル建物を除外し、コンテナ化の定義に該当する小型のパッケージサブディストリビューションのみをカウントしているためと考えられます。これはほとんどの産業購買者がコンテナ化変電所と呼ぶ製品と同じであり、したがって小さい数字は誤りではありませんが、Reaninで表現されているポータブル/プレハブ型サブディストリビューション市場のより狭い理解を示しています。個々の購買者にとって重要なのは、総市場数ではなく、関心のある市場セグメントです。.
購入者はリードタイムが増加しているかどうか、購入する市場セグメントが追加容量を担う主要セグメントであるか、どの国が競争力のある工場スロットの空き状況を提供しているかを確認する必要があります。.
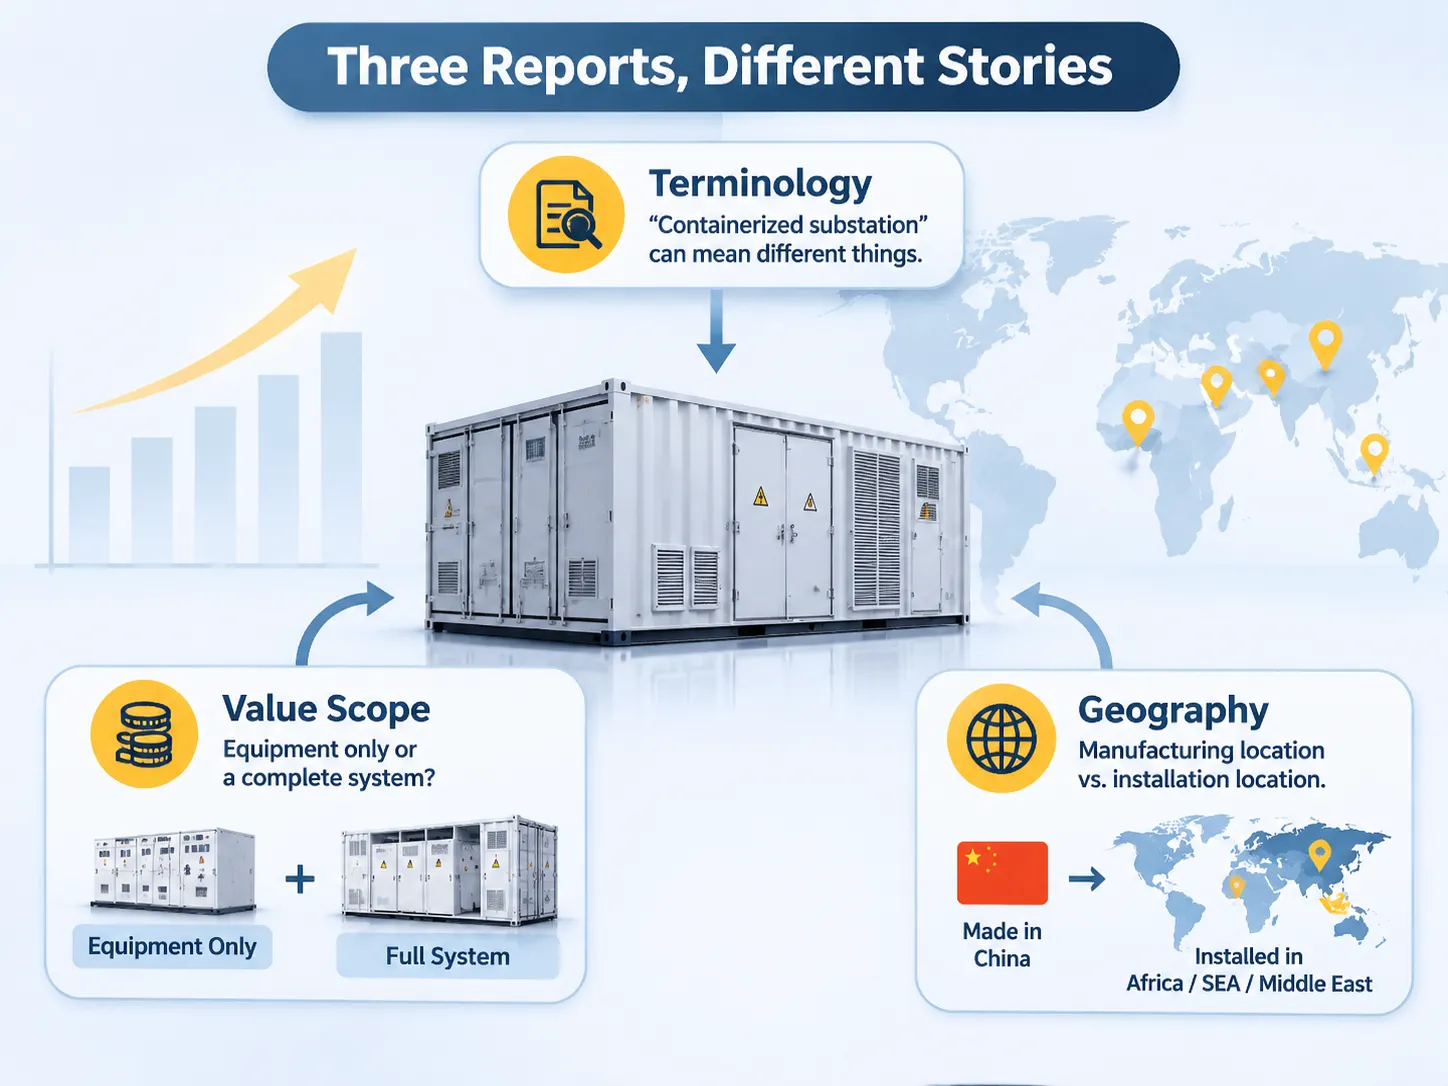
�¤の調査報告書が同じ製品を異なる方法で説明する場合
これらの製品に使用される用語の不一致は、この製品の正確な市場調査を行う上で最大の障害であり、次いで各報告書で報告されるデータの質が問題となります。「コンテナ化変電所」という用語は、「コンテナ」として出荷されるという点以外にほとんど共通点のないさまざまな製品を指すことがあります。複数の企業がコンテナ化変電所として販売しているだけでなく、各メーカーも製品を異なる方法で定義しています。.
�¤の報告書を区別するもう一つの重要なポイントは、変電所のどの価値をカウントするかの判断方法です。例えば、機器のみから得られる変電所収益と、補助機器、保護装置、HVAC、火災抑制を含む完全なシステムから得られる収益では、3つの報告書間で大きな差異が生じる可能性があります。試験済みのアセンブリとして納入される変電所は、必要なすべてのコンポーネントを含むため、変電所機器単体の3倍から5倍の価値を持ちます。, したがって、機器収益のみを捉えた報告書は、総システム収益を捉えた報告書よりも大幅に低い収益数値を示します。.
最後に、製造地と設置地の地理的な違いが、これら3つのレポート間で大きな差異を生じさせています。例えば、アフリカ、東南アジア、中東の都市に設置されるコンテナ型変電所のかなりの割合が中国で製造されています。したがって、設置国を示すレポートはこれらの地域で発生している市場シェアのかなりの部分を捉える一方で、製造国を示す別のレポートは比較的低い市場シェアの割合を示すことになります。.
コンテナ型変電所としてカウントされるもの、されないもの
本書では、コンテナ型変電所を、工場で組み立ておよび試験された変電所であり、1ユニット(または複数ユニット)として現場に出荷され、現場で配線される(組み立てはされない)ことで顧客に電力サービスを提供するものと定義しています。 コンパクト変電所構成リファレンスガイド には、その定義を満たすエンクロージャーの種類が記載されており、多用途の単一変圧器キオスクから低圧室を備えたウォークインパッケージまで含まれています。.
コンテナ型変電所に該当しないものとは?
コンテナ型変電所の定義には以下のエンクロージャータイプが含まれますが、スイッチギアが完全モジュールで到着しても、床が打設され、壁が石造りの標準的な変電所建屋はコンテナ型変電所の定義を満たしません。標準的なコンテナに収められた移動式発電機もコンテナ型変電所の定義には該当しません。スイッチギアなしのコンテナ型パッケージ変電所(エンクロージャー内に変圧器のみがあるもの)は、通常、変電所ではなく変圧器製品としてカウントされます。.
購入者にとっては、供給者が提示する価格が一般的に比較不可能であるという実務的な問題が生じます。例えば、ある供給者が「1,000 kVA コンテナ型変電所」と見積もる場合、それはコンテナに梱包された変圧器を指すかもしれませんが、別の供給者は保護装置、計測器、補助機器、文書化および試験報告書(定期試験)を含む完全なパッケージを提供するかもしれません。したがって、仕様書には製品カテゴリではなく、作業範囲を具体的に明記することが極めて重要です。.
国別成長率とその実際の要因
2026年の国別成長率は、すべての変電所機器およびサービスの需要がどこに集中しているかを特定するため、調査レポートの実用的な部分であり、現在の需要がどこにあるかを示すのではなく(2026年に需要が見込まれる場所を示しています)。.
| 国 | 2026年から2036年の年平均成長率(CAGR) | それを推進する要因 |
|---|---|---|
| 中国 | 11.5% | 工業団地の電化、内陸のユーティリティ規模の太陽光および風力接続、西部州の鉱山電化、アフリカおよび東南アジアへの輸出需要 |
| インド | 10.7% | 国家太陽光ミッション、農村電化、スマートシティプログラム、配電の近代化 |
| ドイツ | 9.8% | エネルギー転換(Energiewende)に伴う風力および蓄電のグリッド接続要件、エネルギー安全保障. |
| フランス | 8.9% | 再生可能エネルギーは原子力発電所の停止によって生じるギャップを埋めます。フランスは鉄道電化回廊を計画しています。 |
| イギリス | 8.1% | Offshore Wind Land Fall Substations. A must for Grid Stability and backup during storms and emergency situations; mobile unit production will assist in areas lacking access to the grid. |
| 米国 | 7.2% | The Distribution of Data Centres is driving Utility Grid Modernisation and the creation of a Storm Resilient Utility Grid in the US. |
| ブラジル | 6.4% | Hydro and solar plants connected to the grid, industrial clusters’ ability to export. |
The pattern is that where the grid is extended and not replaced (new factories using prefabricated units) there is more rapid growth than for markets that have mature grids with more mature & complex products. Thus, while the US market is still one of the two biggest in value, it has had the slowest growth rate on this list.
The most frequently cited limiting factors (as opposed to drivers) according to this particular report and other similar reports are Permitting and Interconnection Queues, in this order. This is consistent with what Commercial Companies see. The Equipment itself is rarely considered to be the long pole, whereas it is the Grid Connection Studies that are.
Data Centres: The Demand Line Nobody Modelled in 2020
In 2021, the reports listed the following four markets as Renewable Energy Mines, Temporary Supply Energy and Disaster Recovery. Data centers were not included in previous projections as populated by the IEA through 2026, but have since changed to explain the rise in data center forecasts, with currently still published Segments Tables showing Renewable Energy as the largest category.
Evidence of this can be found in electricity consumption numbers. The IEA predicts global electric consumption from data centers to reach 415 TWh (approximately 1.5% of total global electric consumption) within 2024, while projecting over 2X increase in electric consumption from data centers to approximately 945 TWh by 2030. Approximately 45% of global electric consumption will be attributable to data centers and the anticipated electric demand growth from data centers is estimated to comprise approximately 50% of all electric demand growth in the U.S. during this same time period.
The implications for this product are as follows: Hyperscale campuses require 100 MW of electricity and above – to be delivered in phases. In addition, the medium voltage distribution for each phase must be separated and metered from each other. A containerised substation can be ordered and factory tested and energized within months; it can also be reused at another site once the initial site has been developed and ready for use. The primary advantage of this approach is based on schedule and there’s no monetary value associated with this product; it is what data center clients wish to purchase.
There are similarly specific constraints associated with this product. The IEA estimates that 20% of planned data center developments will be subject to delays due to insufficient grid connections. At present, substation packages do not eliminate the queue for.
Source: IEA World Energy Outlook 2023, JLL.
The two major applications for the current generation of substations are renewable integration (46.2% of total sales by 2026) and mining (2nd plus extreme requirements). Structural reasons support why the largest revenue generator for renewable integration is solar farms (which typically are located in remote locations with no roads or buildings). To accommodate this characteristic, a complete substation must be supplied at the time of the farm’s construction.
While a wind farm has similar characteristics as a solar farm, the multiple collection points of a wind farm create additional challenges when supplying substations.
Mining substations represent the second largest revenue stream and have the most extreme requirements of any substation type. Mining sites are mobile, and therefore substations must also be mobile. For example, a mining substation located at 2,000 metres above sea level causes the switchgear to derate and alters the creepage distances.
Also, due to the dominant load of large drives used in mining operations, harmonic distortion and a specification stating the short-circuit current must be included.
Finally, the two remaining types of station are temporary supply and disaster recovery.
Temporary supply and disaster recovery are both used for temporary purposes; however, they differ from the other two applications’ customers because their customers are typically either a utility or a rental company rather than a project developer.
When mobility is a key consideration of prefabricated outdoor substations, specifications for these units must reflect that characteristic.
Voltage Mix and the Rating Bands Buyers Order
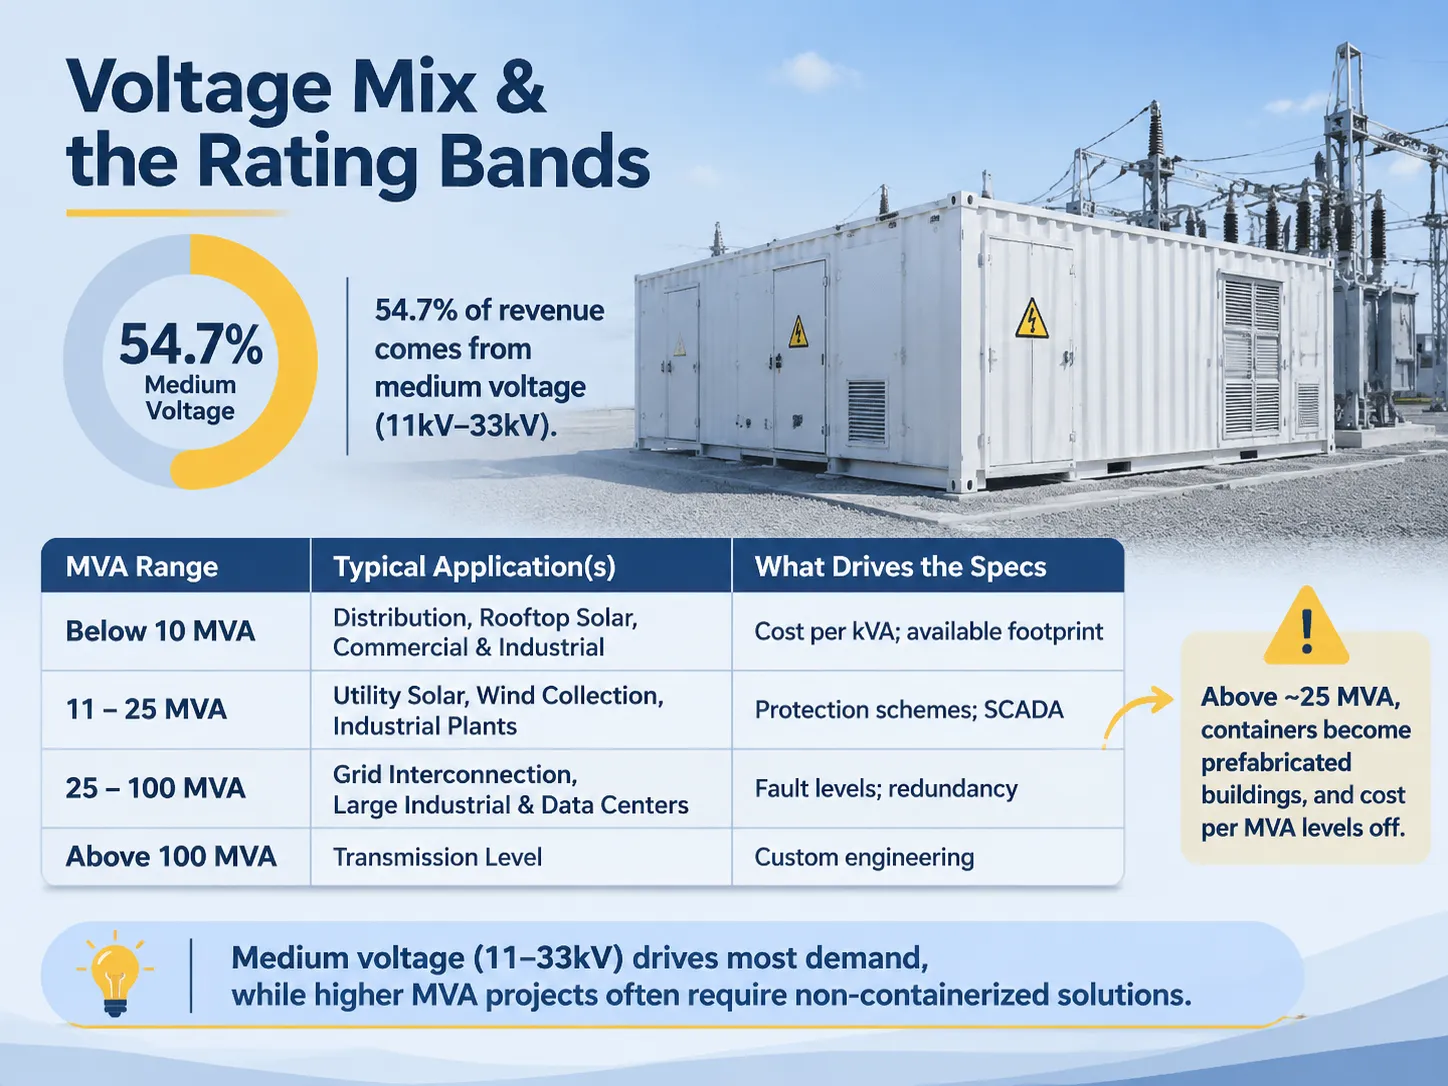
54.7% of total revenue will be generated by medium voltage, which is consistent with what will be installed. Most containerized substations are rated 11kV, 22kV, or 33kV on the primary side and 400V or 480V on the secondary side, because it is more economical to construct a factory-built package in this voltage band than it is to build a factory.
The segmentation of MVA used for research publications provides a better approximation of the actual items sold than voltage split by segmenting the market by application almost exactly.
| MVA range | Typical application(s) | What drives the specs |
|---|---|---|
| Below 10 MVA | Distribution, Rooftop and Ground-Mounted Solar, Commercial and Industrial Facilities | Cost per kVA; available foot print; standardized enclosures. |
| 11 to 25 MVA | Utility Scale Solar Blocks, Wind Collection, Industrial Plants | Protection schemes; SCADA; harmonic distortion limits. |
| 25 to 100 MVA | Interconnection to the grid, Large Industrial and Data Center Complexes | Fault levels; redundancy; metering; compliance. |
| Above 100 MVA | Transmission Level, Generally Not Containerized Unless Used as an E-House | Custom engineering; transport limits; assembly on-site, etc. |
When MVA is above approximately 25 MVA, containers no longer qualify as products but become buildings designed for prefabrication. At that point, the cost per MVA trend begins to level off, so specifiers should be aware of this limitation when making assumptions about continuing economies of scale beyond this range.
Who Is Winning: Tiers, Names and Regional Strength
The competitive landscape can be viewed in three tiers, though no sample market shares have been released. Tier One are global electrical leaders; Tier Two are large regional manufacturers; Tier Three includes a long list of national factories and specialty manufacturers.
Tiers One — ABB, Siemens Alliance, Siemens Energy, Eaton, Schneider Electric and GE. Their advantage lies in the product inside the container: the protection and control systems, the type test documentation, and the utility writing specifications based on their equipment is less contentious than challenges to those specifications. Companies such as Toshiba, Larsen & Toubro, Kirloskar, Crompton Greaves, IMESA, Elsewedy, Meidensha, Powell and Qingdao TGOOD are all examples of manufacturers that fall into Tier Two. Each of these Tier Two manufacturers has a large presence in their respective home geographies as well as in the different market segments that tier two sets the standards for.
Most projects are completed in tier three. This is not a weakness of the tier three market. For example, a 2 MVA distribution package for a solar farm located in Southeast Asia will not require a global protection platform. It will need to contain a compliant transformer, a type tested ring main unit, a documented routine test that covers both the Transformer and Ring Main Unit, and a delivery date.
The elements of the monitoring layer form the basis of the competition in tier three. About half of all new installations now include some form of remote monitoring for the temperature, partial discharge trends, and breaker status information as standard features; this is what the intelligent integrated substation range provides. Although a small additional expense to the package, the intelligent integrated substation capability represents a significant increase to the service contract’s costs and is therefore being adopted by tier three suppliers at a significantly faster rate than their tier one counterparts. In addition, two recent product announcements illustrate the competing priorities between the major manufacturers as they pursue growth. In June 2023, Schneider released its containerized microgrid solution aimed at integrating renewable energy resources off the grid. In October 2022, Siemens Energy introduced a containerized substation for access into emerging markets, especially Africa. Both manufacturers have recognised this is where the bottleneck exists within the grid’s connection to each company’s product offerings.
What the Market Data Does Not Tell a Buyer
The most important piece of information that a buyer needs to know before they look to purchase is the price per MVA, which is not provided in any of the summaries available to the public. The only information currently available to buyers is the pricing range of the different packages that include Transformer, MV Switchgear, LV Distribution, and Basic Protection Packages, which appear to average USD $80,000 – 200,000 for a 1 MVA and USD $500,000 – 1.2 million for a 10 MVA. The difference in prices within each category reflects the scope of work involved, as opposed to the profit margin for any individual company.
Another significant piece of information that is missing from the published data is the estimated lead time for equipment delivery. A 1 to 2.5 MVA standard distribution package will generally be available 12 – 20 weeks after placing a factory order with the manufacturer, primarily because the Transformer and Ring Main Unit are standard catalogue products. However, an End-User Utility specification with a custom protection scheme and factory witness testing and a defined short circuit study will take between 6 – 9 months to complete, primarily due to the need for Engineering Approval rather than the time involved in the manufacturing process.
The last important piece of data missing from the published market data is the site development cost associated with the equipment that the Buyer is attempting to replace with a containerised solution. The containerised solution will still require a foundation, cable trench, earth grid and connection agreement. Based on the Manufacturer’s claims, the site development costs and resulting speed of installation of a containerised solution are, in fact on average, 25 – 30% lower in comparison to building a brick structure, but this comparison is misleading. The comparison being made in the published data is to a fully functional transformer that is located on a foundation.
Where Subian Fits in This Market
Subian provides the majority of our volume when it comes to medium voltage distribution packages that range from several hundred kVA to approximately 10 MVA. Our packages can be supplied in both an enclosure-type box structure or as a containerized assembly, which includes the distribution transformer and all required MV and LV switchgear and LV distribution components pre-assembled and factory-tested prior to leaving the manufacturing facility. This accounts for approximately 54.7 percent of the overall market as discussed in this report, and it is where the factory with a dedicated transformer manufacturing facility has an advantage over integrators who do not have this capability and must purchase the transformers.
Subian’s offering in the distribution transformer and substations includes all standard configuration options: 11, 22 and 33 kV primary voltage, 400 to 480 volts secondary voltage, ONAN or ONAF cooling, and enclosure options available in painted steel, galvanized steel, or stainless, depending on where the equipment will be located. Subian’s employees configure the monitoring systems for each customer based on their specific requirements. Therefore, there is no “standard” for monitoring configurations, since it is likely that a mining customer who has no communication link will not wish to purchase telemetry that he/she cannot use.
Subian does not position itself to compete with the larger tier one providers; to do so would result in wasted resources for both sides. If a project specification requires any of the following: a global protection scheme, a specific type of relay, or a utility-type test certificate, the tier one providers will provide a superior product to Subian, therefore we would expend resources unnecessarily for both parties by quoting on this type of project. Conversely, when a project specification is performance-driven, the same type of performance rating is available at a different cost and lead time.
What to Watch Through 2030
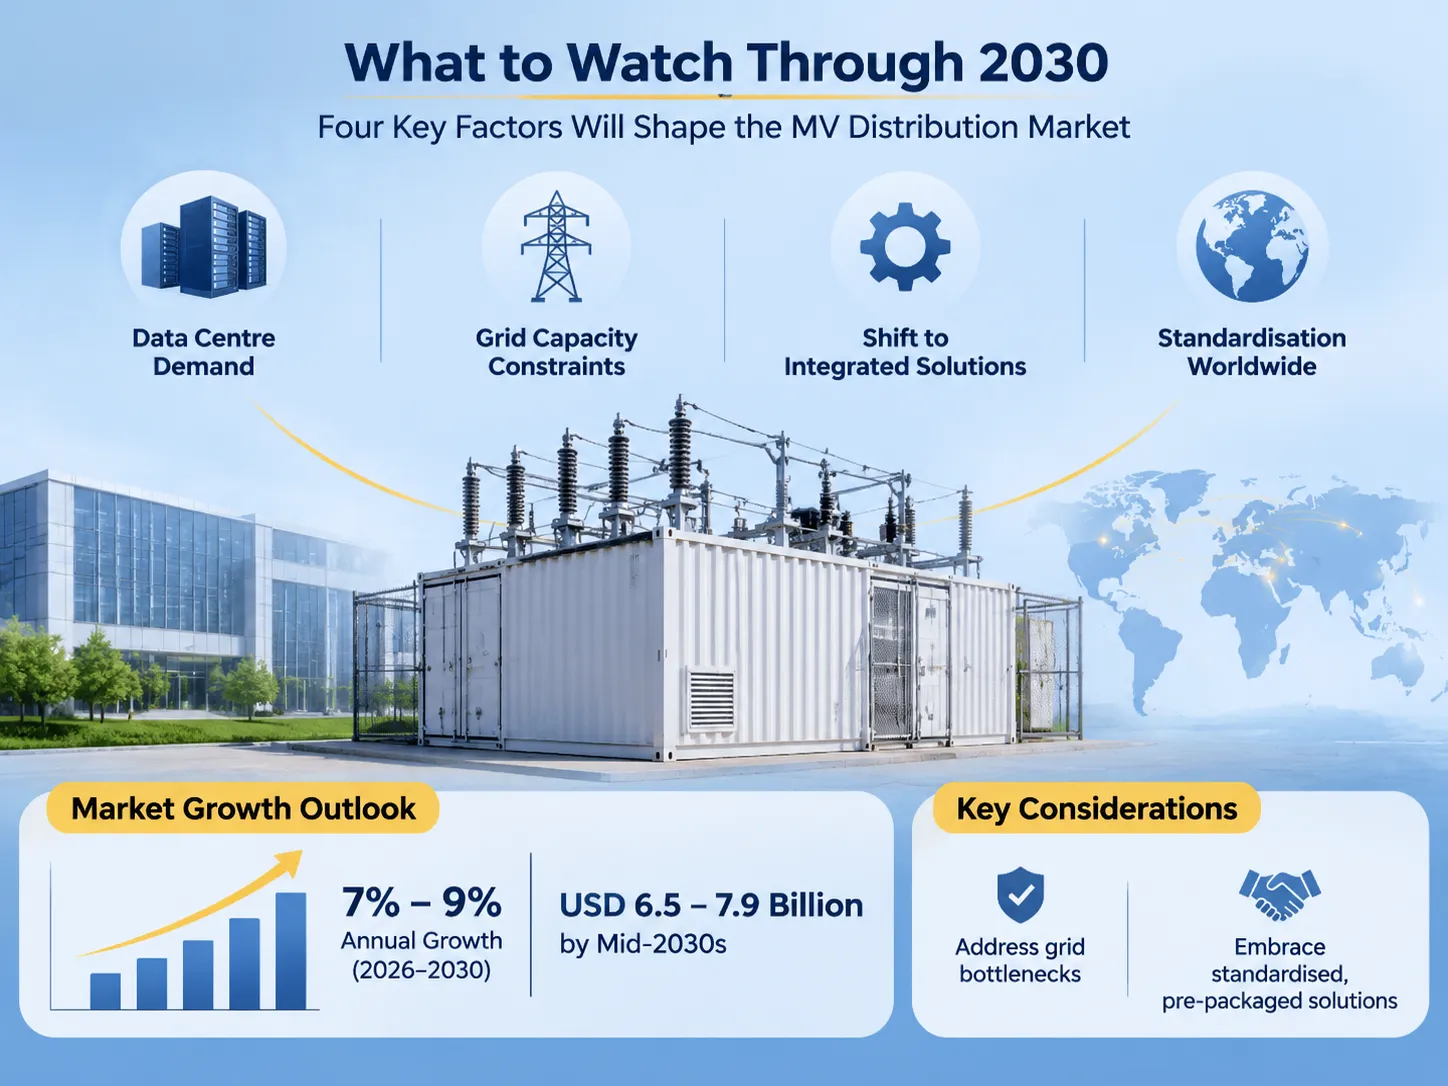
By 2030, the continued state of the medium voltage distribution market will be driven by the following four factors, with only three factors visible in the data to date:
The following areas are potential barriers to developing a sizable global containerized substation market:
- Daily growth of the data centre segment exceeds expectations according to most specialised publications. This suggests that the average size of a data centre will continue to increase, leading to a decrease in the number of smaller manufacturing facilities that supply to the sector. This is due to the fact that a typical 100 MW data centre buyer does not typically use a product catalogue for purchasing.
- There is insufficient capacity on the electrical grid to support large scale data centre development. A significant number of proposed data centres are currently experiencing construction delays due to the limited capacity of the grid. Therefore, product availability to shorten construction is not likely to have any effect on the length of time it takes to complete the necessary studies to obtain a construction permit. This situation will likely serve to limit the ability to grow in high-demand markets.
- There is a major transition from the sale of individual pieces of equipment to the sale of pre-packaged solutions. Recent reports indicate that approximately 50% of the data centre systems installed today are being monitored remotely. An even larger percentage (approximately 65%) of respondents to a recent survey indicated that they plan to increase their investment in remote monitoring solutions. As such, customers will be purchasing uptime and reporting, as opposed to buying the actual hardware.
- Countries are moving toward adopting standards. Each country has its own MV standard voltage. Each country also has its own MV design philosophy and each country has its own route of approval. A manufacturing operation that can offer three or four configurations in tooling will have a competitive advantage over an operation that is developing a new configuration for every order. The international comparison of substations provides examples of how these configurations vary throughout the world and represents the pragmatic continuation of this movement toward standardisation.
A market report released over the fall of 2026 predicted between USD 3.3 billion and USD 3.5 billion in revenue, a narrower definition placing it closer to USD 1.3 billion. In 2026, the annual growth forecast is expected to be between 7 per cent and 9 per cent with values at mid-2030s ranging from USD 6.5 billion to USD 7.9 billion depending on the scope.
よくある質問
Why are there contradictions among the size of the market in certain reports?
Market reports disagree with one another because they define the product differently: some are based on equipment revenue, whereas others include the delivered packaged product, including all protection, auxiliaries and testing. Some count large volumes of prefabricated buildings, whereas others count cargo crates and skids. The growth rate between market reports is more closely aligned than the total value.
Which region is experiencing the most growth?
China is experiencing the most rapid growth at approximately 11.5 per cent annually through 2036, followed by India at about 10.7 per cent. Both regions are ‘growing out’ rather than ‘replacing’ existing grids, which allows factory-built units to offer the fastest delivery times. While the United States is the slowest growing region among large markets and the growth is expected to be approximately 7.2 per cent, it is also a large market based on the financial value of its units being larger.
Are data centres currently driving the growth of the containerized substation market?
Currently, data centres are the fastest growing application for containerised substations; however, data centres are not yet the largest segment in the published tables. Published tables report renewable integration accounts for approximately 46 per cent of total sustained demand. The electricity consumed by data centre demand is found in the electricity statistics: a projected 415 TWh of electricity consumption in 2024 increasing to around 945 TWh in 2030, with approximately 45 per cent of consumption occurring within the United States.
What is the typical size substation that is packaged as a containerised substation?
The majority of packages will typically be less than 25 MVA and most packages will have a volume rating of less than 10 MVA. When packages exceed 25 MVA they become prefabricated buildings, and when they exceed 100 MVA they become E-Houses which are custom designed and assembled on site. The per MVA price will cease to fall at this transition.
What is the lead time to receive a containerised substation package?
Lead times for containerised substation packages will vary between twelve and twenty weeks for standard 1 to 2.5 MVA distribution packages, as the transformer and switchgear are catalogue products. Lead times for Utility Specification Containerised Substation packages will be six to nine months, and the reason for this delay is due to the need for customised protection and completion of engineering approvals versus actual production timelines.
参考文献
- Future Market Insights — Containerized Substation Market
- The Insight Partners — Containerized Substation Market
- Reanin — Containerized Substation Market
- IEA — Energy and AI
- Hitachi Energy — Grid and Substation Technology
結論
コンテナ型変電所市場は、30億ドルから40億ドルの規模に成長すると予測されており、成長率は7%から9%と見込まれていますが、報告間の差異は、同じ市場の定義が互いに矛盾していることに起因しており、類似のデータソースに基づいています。現在、コンテナ型変電所市場における最大の収益シェアは、再生可能エネルギー統合、公益事業、中電圧市場からもたらされます。データセンターの需要が現在の予測に変化をもたらすでしょう。.
For purchasers of containerised substations, it will be important to remember that the lead time for receipt is based on engineering approvals and not on factory capacity, and that the value of ratings under 10 MVA are the valued segments. In addition, that the specifications of a product, not its category, determines which two quotations can be compared against each other.