


С точки зрения рынка контейнерных подстанций, он за последние шесть лет значительно вырос (т.е. от нишевого продукта до типичного решения), однако наблюдается заметное отставание в отношении фактических маркетинговых исследований по этой категории продукции. Три отчёта, опубликованные в 2026 году, каждый от одной из трёх крупных консалтинговых компаний, оценили рынок контейнерных подстанций по трем разным величинам: 1,3 млрд USD, 3,3 млрд USD и 3,5 млрд USD. Разница между этими тремя оценками — это не просто незначительное округление. Следовательно, лучшая информация для покупателя — это понимание различий в области охвата и оценок общего объёма.
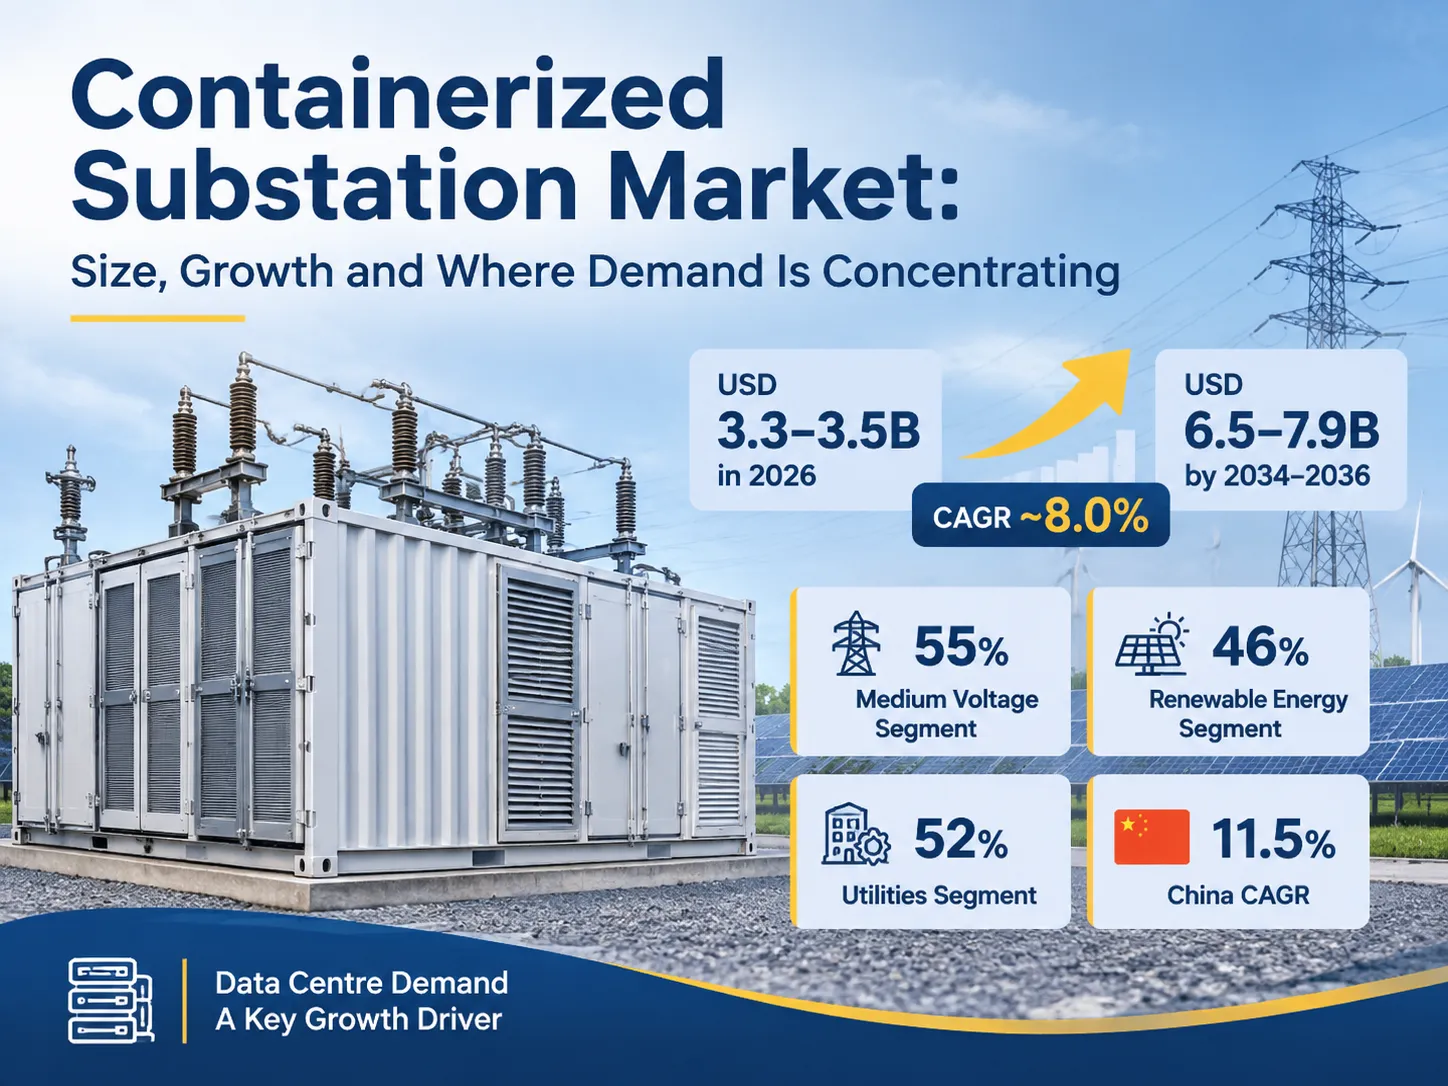
Чтобы упростить моё предыдущее предположение, общий размер или стоимость рынка контейнерных подстанций оценивается в диапазоне от 3,3 млрд USD до 3,5 млрд USD в 2026 году. Прогнозируемый среднегодовой темп роста составляет примерно 8,01%, что позволит этому рынку вырасти до стоимости от 6,5 млрд USD до 7,9 млрд USD к 2034–2036 годам. Ожидается, что 55% (55%) от ожидаемой выручки будет получено из сегмента среднего напряжения, в то время как крупнейший сегмент ожидаемой выручки будет приходиться на сегмент возобновляемой энергетики (46%) от общей выручки рынка. 52% (52%) будет получено из сегмента коммунальных предприятий от общего рынка, а самой быстрорастущей страной станет Китай с ежегодным сложным ростом 11,5%. Спрос на дата-центры не был адекватно учтён во всех прогнозах 2021 года.
Почему три отчёта дают три разные цифры
Три опубликованных отчёта до настоящего времени все предоставили прогнозы будущего роста рынка. В прогнозах по процентному росту наблюдается согласованность, но они расходятся в абсолютных размерах рынка. Следовательно, все три отчёта используют разные методы оценки. Очевидно, что будет продолжаться рост рынка в области сборных и портативных подраспределительных подстанций из-за скорости, с которой необходимо подключать новые сетевые соединения для обеспечения растущего спроса, как показано на графике ниже.
| Источник | Значение базового года | Прогнозируемое значение | CAGR (среднегодовой темп роста) | Что включено |
|---|---|---|---|---|
| Future Market Insights | 3,20 млрд USD (2025); 3,47 млрд USD (2026) | 7,85 млрд USD (2036) | 8.5% | Рынок сборных портативных подраспределительных подстанций |
| The Insight Partners | 3,27 млрд USD (2025) | 6,56 млрд USD (2034) | 8.04% | Та же продуктовая линейка, сегментированная по диапазону MVA, включая свыше 100 MVA |
| Reanin | 1,32 млрд USD (2025) | 2,09 млрд USD (2032) | 6.7% | Более узкое определение, ближе к портативным подстанциям на раме |
Из представленных выше данных видно общее согласие, что общий рынок портативных и сборных подраспределительных устройств сегодня (2025) будет находиться в диапазоне от $3B до $4B, с соответствующим темпом роста рынка примерно 7 – 9%. Прогноз Reanin примерно в 1/3 меньше, чем у двух других отчетов; однако, вероятно, это связано с исключением Reanin более крупных сборных портативных зданий и учетом только меньших упакованных подраспределительных устройств, которые подпадают под определение контейнеризованных. Это тот же продукт, который используют большинство промышленных покупателей, когда говорят о контейнеризованных подстанциях, поэтому меньшая цифра не является неправильной, а представляет собой менее широкое понимание рынка портативных/сборных подраспределительных устройств, как это отражено в Reanin. Для любого отдельного покупателя релевантной информацией является сегмент(ы) рынка, в котором он заинтересован, а не общая численность рынка.
Покупателю необходимо определить, увеличиваются ли сроки поставки, является ли сегмент рынка, в котором он приобретает продукцию, основным сегментом, принимающим дополнительную мощность, и какие страны обеспечивают конкурентоспособную доступность производственных слотов.
Когда три исследовательских отчета описывают один и тот же продукт по-разному
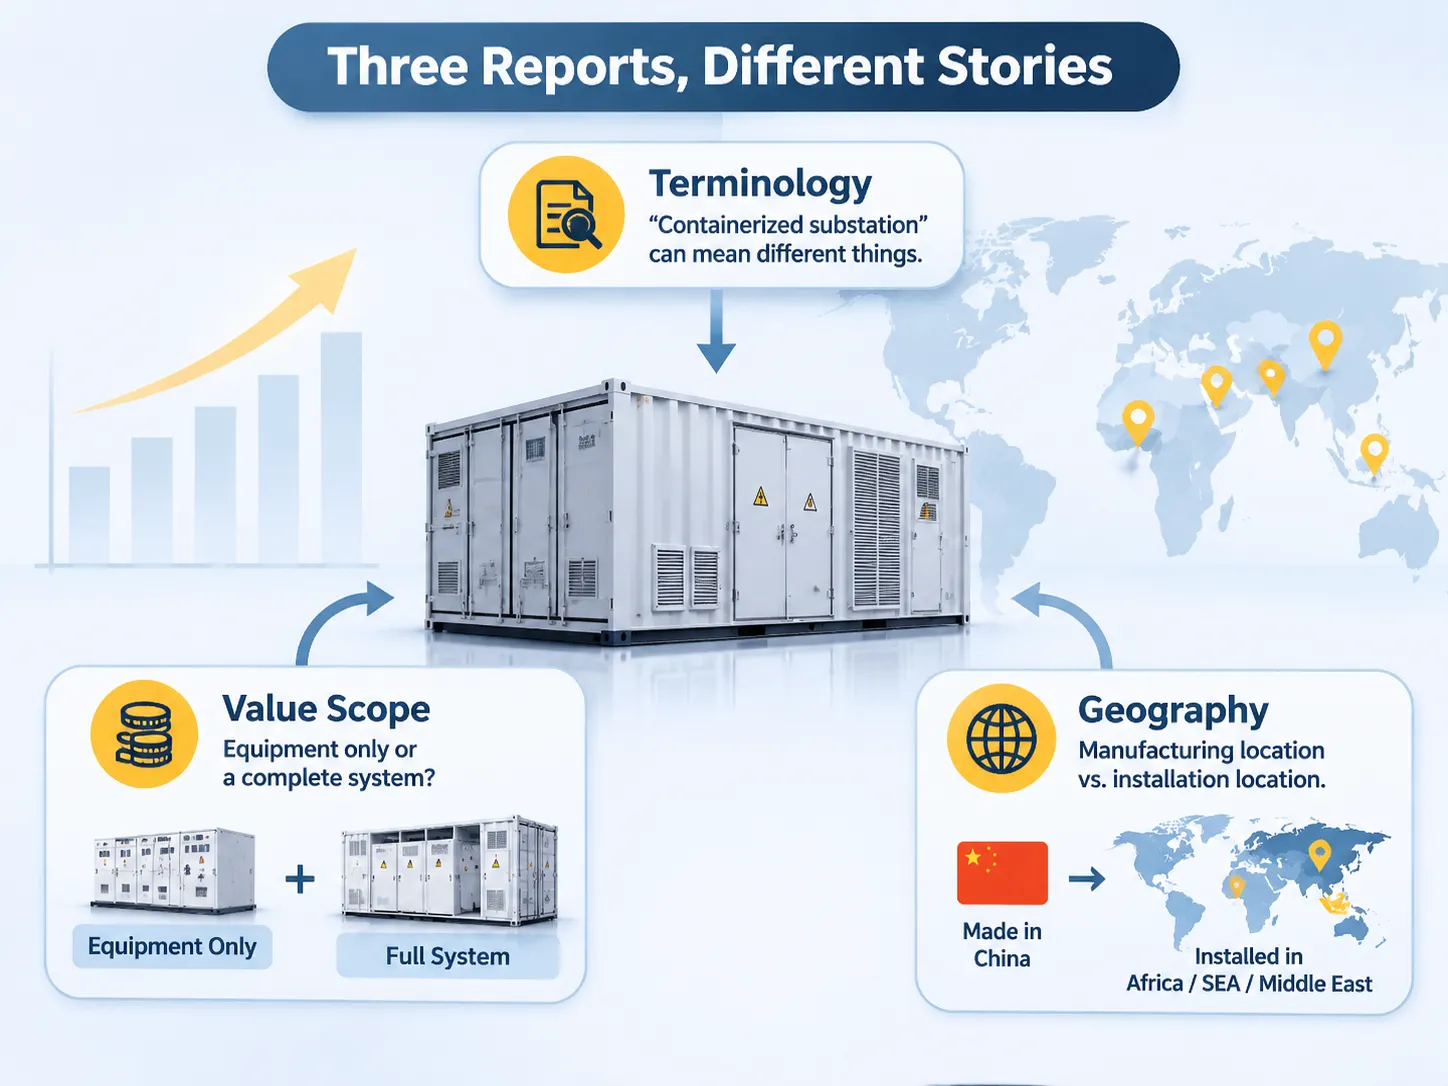
Несоответствие используемых терминов для этих продуктов представляет собой наибольшее препятствие для проведения точных маркетинговых исследований по этому продукту, за которым следует качество данных, представленных в соответствующих отчетах. Термин “контейнеризованная подстанция” может использоваться для описания различных продуктов, которые имеют очень мало общего, кроме того, что они поставляются как “контейнер”. Помимо того, что этот продукт продается различными компаниями как контейнеризованная подстанция, различные производители также определяют продукт по-разному.
Еще одним ключевым моментом для различения трех отчетов является способ определения стоимости подстанции, которая учитывается. Например, доход от подстанции, полученный только от оборудования, по сравнению с доходом от полной системы (с вспомогательным оборудованием, защитой, HVAC и системой пожаротушения) может вызвать значительные различия между тремя отчетами. Подстанции, поставляемые как испытанная сборка, оцениваются в три-пять раз выше стоимости только оборудования подстанции за счет включения всех необходимых компонентов в испытанном блоке, и поэтому, отчет, учитывающий только доход от оборудования, будет показывать значительно меньшую сумму дохода, чем отчет, учитывающий доход от полной системы..
Наконец, географическое различие между местами производства и установки приводит к огромным расхождениям между этими тремя отчетами. Например, значительный процент контейнерных подстанций, устанавливаемых в городах Африки/Юго-Восточной Азии/Ближнего Востока, производится в Китае. Следовательно, отчет, отражающий страну установки, зафиксирует значительную долю рынка в этих регионах, в то время как второй отчет, отражающий страну производства, покажет сравнительно меньший процент доли рынка.
Что считается контейнерной подстанцией, а что нет
Контейнерная подстанция в данном документе описывается как заводская собранная и протестированная подстанция, которая доставляется на объект в виде одного блока (или, возможно, двух и более блоков), которые будут подключены (но не собраны) на месте для обеспечения коммунального обслуживания клиентов. Руководство по компактным конфигурациям подстанций определяет типы корпусов, соответствующие этому определению, включая универсальный киоск с одним трансформатором и проходной пакет с низковольтным помещением.
Что не является контейнерной подстанцией?
Определение контейнерной подстанции включает типы корпусов, указанные ниже; однако стандартное здание подстанции с залитыми полами и каменными стенами не соответствует определению контейнерной подстанции, даже если распределительное устройство поставляется в виде готовых модулей. Мобильный генератор, размещенный в стандартном контейнере, не соответствует определению контейнерной подстанции. Контейнерная пакетная подстанция без распределительного устройства (только трансформаторы внутри корпусов) обычно учитывается как трансформаторный продукт, а не как подстанция.
Для покупателя это создает практическую проблему, поскольку цены, предоставляемые поставщиками, обычно несопоставимы, например: один поставщик, предлагающий “контейнерную подстанцию 1000 кВА”, может предлагать трансформатор, упакованный в контейнер, в то время как второй поставщик может предоставить полный пакет, включая защиту, измерения, вспомогательное оборудование, документированный и протестированный отчет (рутинный). Поэтому крайне важно, чтобы в техническом задании конкретно указывался объем работ, а не категория продукта.
Рост по странам и что на самом деле его стимулирует
Темпы роста по странам на 2026 год являются практической частью исследовательского отчета, поскольку они показывают, где сосредоточен спрос на все оборудование и услуги подстанций, а не где спрос находится в настоящее время (они показывают, где ожидается спрос в 2026 году).
| Страна | CAGR с 2026 по 2036 год | Что его стимулирует |
|---|---|---|
| Китай | 11.5% | Электрификация промышленных парков, подключение солнечных и ветровых электростанций коммунального масштаба, электрификация горнодобывающих регионов западных провинций, экспортный спрос в Африку и Юго-Восточную Азию |
| Индия | 10.7% | Национальная солнечная миссия, электрификация сельских районов, программа умных городов, модернизация распределения |
| Германия | 9.8% | Требования к подключению к сети Energiewende включают ветер и накопители, энергетическую безопасность. |
| Франция | 8.9% | Возобновляемые источники энергии заполнят пробелы, образующиеся при закрытии атомных электростанций. Франция планирует коридоры электрификации железных дорог |
| Великобритания | 8.1% | Offshore Wind Land Fall Substations. A must for Grid Stability and backup during storms and emergency situations; mobile unit production will assist in areas lacking access to the grid. |
| США | 7.2% | The Distribution of Data Centres is driving Utility Grid Modernisation and the creation of a Storm Resilient Utility Grid in the US. |
| Бразилия | 6.4% | Hydro and solar plants connected to the grid, industrial clusters’ ability to export. |
The pattern is that where the grid is extended and not replaced (new factories using prefabricated units) there is more rapid growth than for markets that have mature grids with more mature & complex products. Thus, while the US market is still one of the two biggest in value, it has had the slowest growth rate on this list.
The most frequently cited limiting factors (as opposed to drivers) according to this particular report and other similar reports are Permitting and Interconnection Queues, in this order. This is consistent with what Commercial Companies see. The Equipment itself is rarely considered to be the long pole, whereas it is the Grid Connection Studies that are.
Data Centres: The Demand Line Nobody Modelled in 2020
In 2021, the reports listed the following four markets as Renewable Energy Mines, Temporary Supply Energy and Disaster Recovery. Data centers were not included in previous projections as populated by the IEA through 2026, but have since changed to explain the rise in data center forecasts, with currently still published Segments Tables showing Renewable Energy as the largest category.
Evidence of this can be found in electricity consumption numbers. The IEA predicts global electric consumption from data centers to reach 415 TWh (approximately 1.5% of total global electric consumption) within 2024, while projecting over 2X increase in electric consumption from data centers to approximately 945 TWh by 2030. Approximately 45% of global electric consumption will be attributable to data centers and the anticipated electric demand growth from data centers is estimated to comprise approximately 50% of all electric demand growth in the U.S. during this same time period.
The implications for this product are as follows: Hyperscale campuses require 100 MW of electricity and above – to be delivered in phases. In addition, the medium voltage distribution for each phase must be separated and metered from each other. A containerised substation can be ordered and factory tested and energized within months; it can also be reused at another site once the initial site has been developed and ready for use. The primary advantage of this approach is based on schedule and there’s no monetary value associated with this product; it is what data center clients wish to purchase.
There are similarly specific constraints associated with this product. The IEA estimates that 20% of planned data center developments will be subject to delays due to insufficient grid connections. At present, substation packages do not eliminate the queue for.
Source: IEA World Energy Outlook 2023, JLL.
The two major applications for the current generation of substations are renewable integration (46.2% of total sales by 2026) and mining (2nd plus extreme requirements). Structural reasons support why the largest revenue generator for renewable integration is solar farms (which typically are located in remote locations with no roads or buildings). To accommodate this characteristic, a complete substation must be supplied at the time of the farm’s construction.
While a wind farm has similar characteristics as a solar farm, the multiple collection points of a wind farm create additional challenges when supplying substations.
Mining substations represent the second largest revenue stream and have the most extreme requirements of any substation type. Mining sites are mobile, and therefore substations must also be mobile. For example, a mining substation located at 2,000 metres above sea level causes the switchgear to derate and alters the creepage distances.
Also, due to the dominant load of large drives used in mining operations, harmonic distortion and a specification stating the short-circuit current must be included.
Finally, the two remaining types of station are temporary supply and disaster recovery.
Temporary supply and disaster recovery are both used for temporary purposes; however, they differ from the other two applications’ customers because their customers are typically either a utility or a rental company rather than a project developer.
When mobility is a key consideration of prefabricated outdoor substations, specifications for these units must reflect that characteristic.
Voltage Mix and the Rating Bands Buyers Order
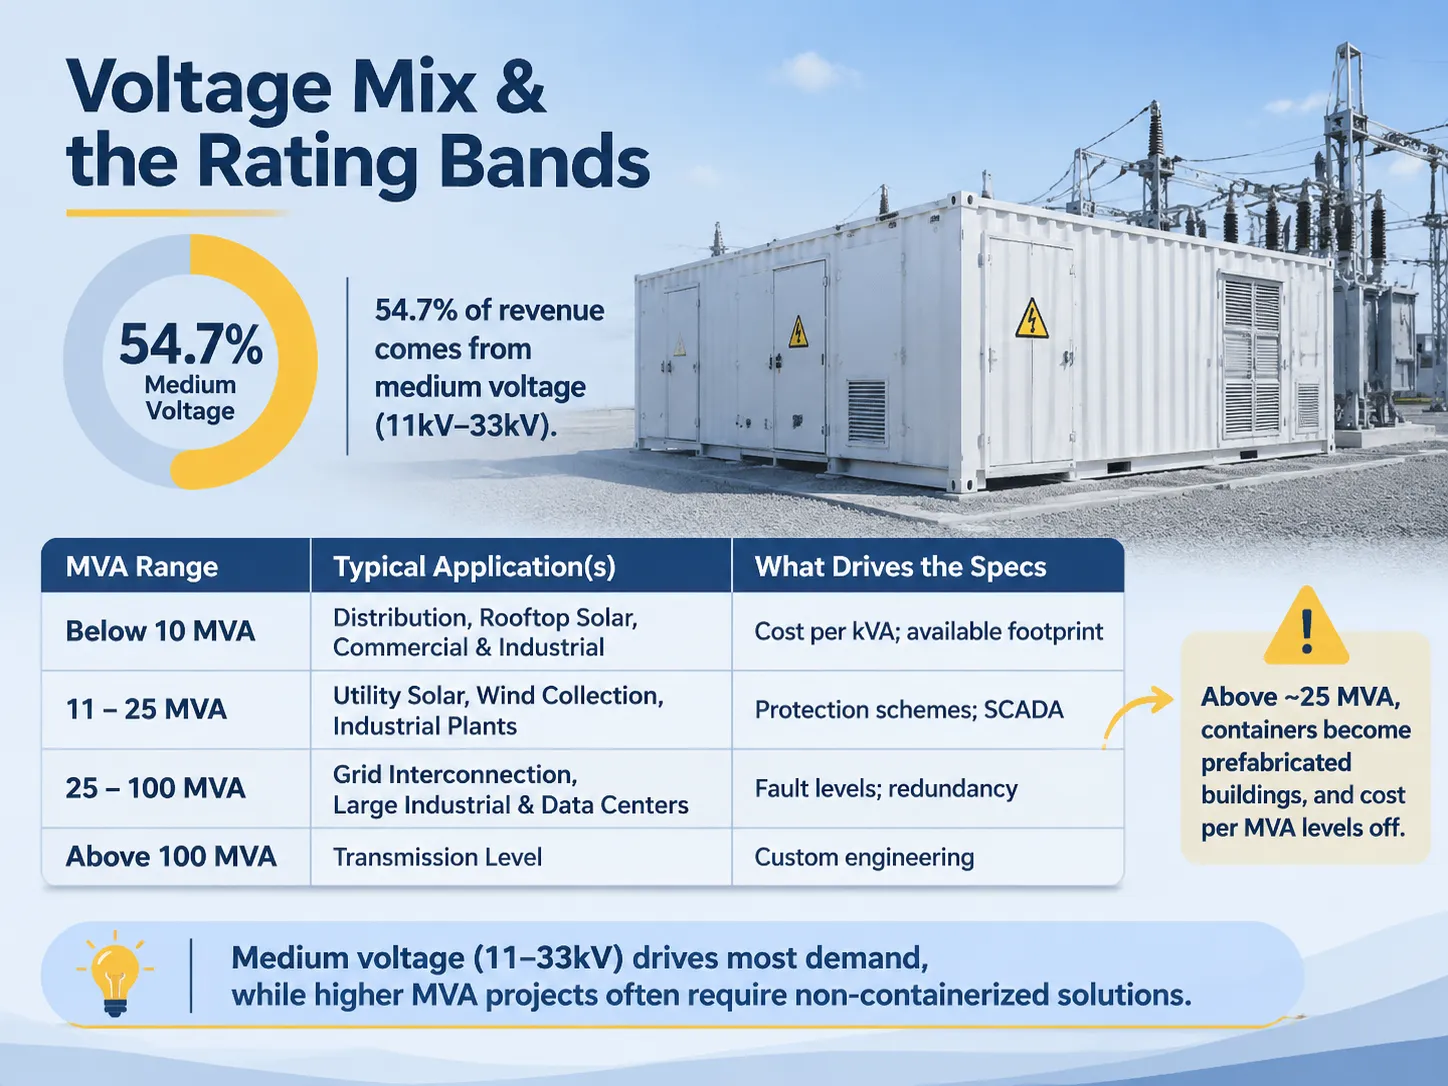
54.7% of total revenue will be generated by medium voltage, which is consistent with what will be installed. Most containerized substations are rated 11kV, 22kV, or 33kV on the primary side and 400V or 480V on the secondary side, because it is more economical to construct a factory-built package in this voltage band than it is to build a factory.
The segmentation of MVA used for research publications provides a better approximation of the actual items sold than voltage split by segmenting the market by application almost exactly.
| MVA range | Typical application(s) | What drives the specs |
|---|---|---|
| Below 10 MVA | Distribution, Rooftop and Ground-Mounted Solar, Commercial and Industrial Facilities | Cost per kVA; available foot print; standardized enclosures. |
| 11 to 25 MVA | Utility Scale Solar Blocks, Wind Collection, Industrial Plants | Protection schemes; SCADA; harmonic distortion limits. |
| 25 to 100 MVA | Interconnection to the grid, Large Industrial and Data Center Complexes | Fault levels; redundancy; metering; compliance. |
| Above 100 MVA | Transmission Level, Generally Not Containerized Unless Used as an E-House | Custom engineering; transport limits; assembly on-site, etc. |
When MVA is above approximately 25 MVA, containers no longer qualify as products but become buildings designed for prefabrication. At that point, the cost per MVA trend begins to level off, so specifiers should be aware of this limitation when making assumptions about continuing economies of scale beyond this range.
Who Is Winning: Tiers, Names and Regional Strength
The competitive landscape can be viewed in three tiers, though no sample market shares have been released. Tier One are global electrical leaders; Tier Two are large regional manufacturers; Tier Three includes a long list of national factories and specialty manufacturers.
Tiers One — ABB, Siemens Alliance, Siemens Energy, Eaton, Schneider Electric and GE. Their advantage lies in the product inside the container: the protection and control systems, the type test documentation, and the utility writing specifications based on their equipment is less contentious than challenges to those specifications. Companies such as Toshiba, Larsen & Toubro, Kirloskar, Crompton Greaves, IMESA, Elsewedy, Meidensha, Powell and Qingdao TGOOD are all examples of manufacturers that fall into Tier Two. Each of these Tier Two manufacturers has a large presence in their respective home geographies as well as in the different market segments that tier two sets the standards for.
Most projects are completed in tier three. This is not a weakness of the tier three market. For example, a 2 MVA distribution package for a solar farm located in Southeast Asia will not require a global protection platform. It will need to contain a compliant transformer, a type tested ring main unit, a documented routine test that covers both the Transformer and Ring Main Unit, and a delivery date.
The elements of the monitoring layer form the basis of the competition in tier three. About half of all new installations now include some form of remote monitoring for the temperature, partial discharge trends, and breaker status information as standard features; this is what the intelligent integrated substation range provides. Although a small additional expense to the package, the intelligent integrated substation capability represents a significant increase to the service contract’s costs and is therefore being adopted by tier three suppliers at a significantly faster rate than their tier one counterparts. In addition, two recent product announcements illustrate the competing priorities between the major manufacturers as they pursue growth. In June 2023, Schneider released its containerized microgrid solution aimed at integrating renewable energy resources off the grid. In October 2022, Siemens Energy introduced a containerized substation for access into emerging markets, especially Africa. Both manufacturers have recognised this is where the bottleneck exists within the grid’s connection to each company’s product offerings.
What the Market Data Does Not Tell a Buyer
The most important piece of information that a buyer needs to know before they look to purchase is the price per MVA, which is not provided in any of the summaries available to the public. The only information currently available to buyers is the pricing range of the different packages that include Transformer, MV Switchgear, LV Distribution, and Basic Protection Packages, which appear to average USD $80,000 – 200,000 for a 1 MVA and USD $500,000 – 1.2 million for a 10 MVA. The difference in prices within each category reflects the scope of work involved, as opposed to the profit margin for any individual company.
Another significant piece of information that is missing from the published data is the estimated lead time for equipment delivery. A 1 to 2.5 MVA standard distribution package will generally be available 12 – 20 weeks after placing a factory order with the manufacturer, primarily because the Transformer and Ring Main Unit are standard catalogue products. However, an End-User Utility specification with a custom protection scheme and factory witness testing and a defined short circuit study will take between 6 – 9 months to complete, primarily due to the need for Engineering Approval rather than the time involved in the manufacturing process.
The last important piece of data missing from the published market data is the site development cost associated with the equipment that the Buyer is attempting to replace with a containerised solution. The containerised solution will still require a foundation, cable trench, earth grid and connection agreement. Based on the Manufacturer’s claims, the site development costs and resulting speed of installation of a containerised solution are, in fact on average, 25 – 30% lower in comparison to building a brick structure, but this comparison is misleading. The comparison being made in the published data is to a fully functional transformer that is located on a foundation.
Where Subian Fits in This Market
Subian provides the majority of our volume when it comes to medium voltage distribution packages that range from several hundred kVA to approximately 10 MVA. Our packages can be supplied in both an enclosure-type box structure or as a containerized assembly, which includes the distribution transformer and all required MV and LV switchgear and LV distribution components pre-assembled and factory-tested prior to leaving the manufacturing facility. This accounts for approximately 54.7 percent of the overall market as discussed in this report, and it is where the factory with a dedicated transformer manufacturing facility has an advantage over integrators who do not have this capability and must purchase the transformers.
Subian’s offering in the distribution transformer and substations includes all standard configuration options: 11, 22 and 33 kV primary voltage, 400 to 480 volts secondary voltage, ONAN or ONAF cooling, and enclosure options available in painted steel, galvanized steel, or stainless, depending on where the equipment will be located. Subian’s employees configure the monitoring systems for each customer based on their specific requirements. Therefore, there is no “standard” for monitoring configurations, since it is likely that a mining customer who has no communication link will not wish to purchase telemetry that he/she cannot use.
Subian does not position itself to compete with the larger tier one providers; to do so would result in wasted resources for both sides. If a project specification requires any of the following: a global protection scheme, a specific type of relay, or a utility-type test certificate, the tier one providers will provide a superior product to Subian, therefore we would expend resources unnecessarily for both parties by quoting on this type of project. Conversely, when a project specification is performance-driven, the same type of performance rating is available at a different cost and lead time.
What to Watch Through 2030
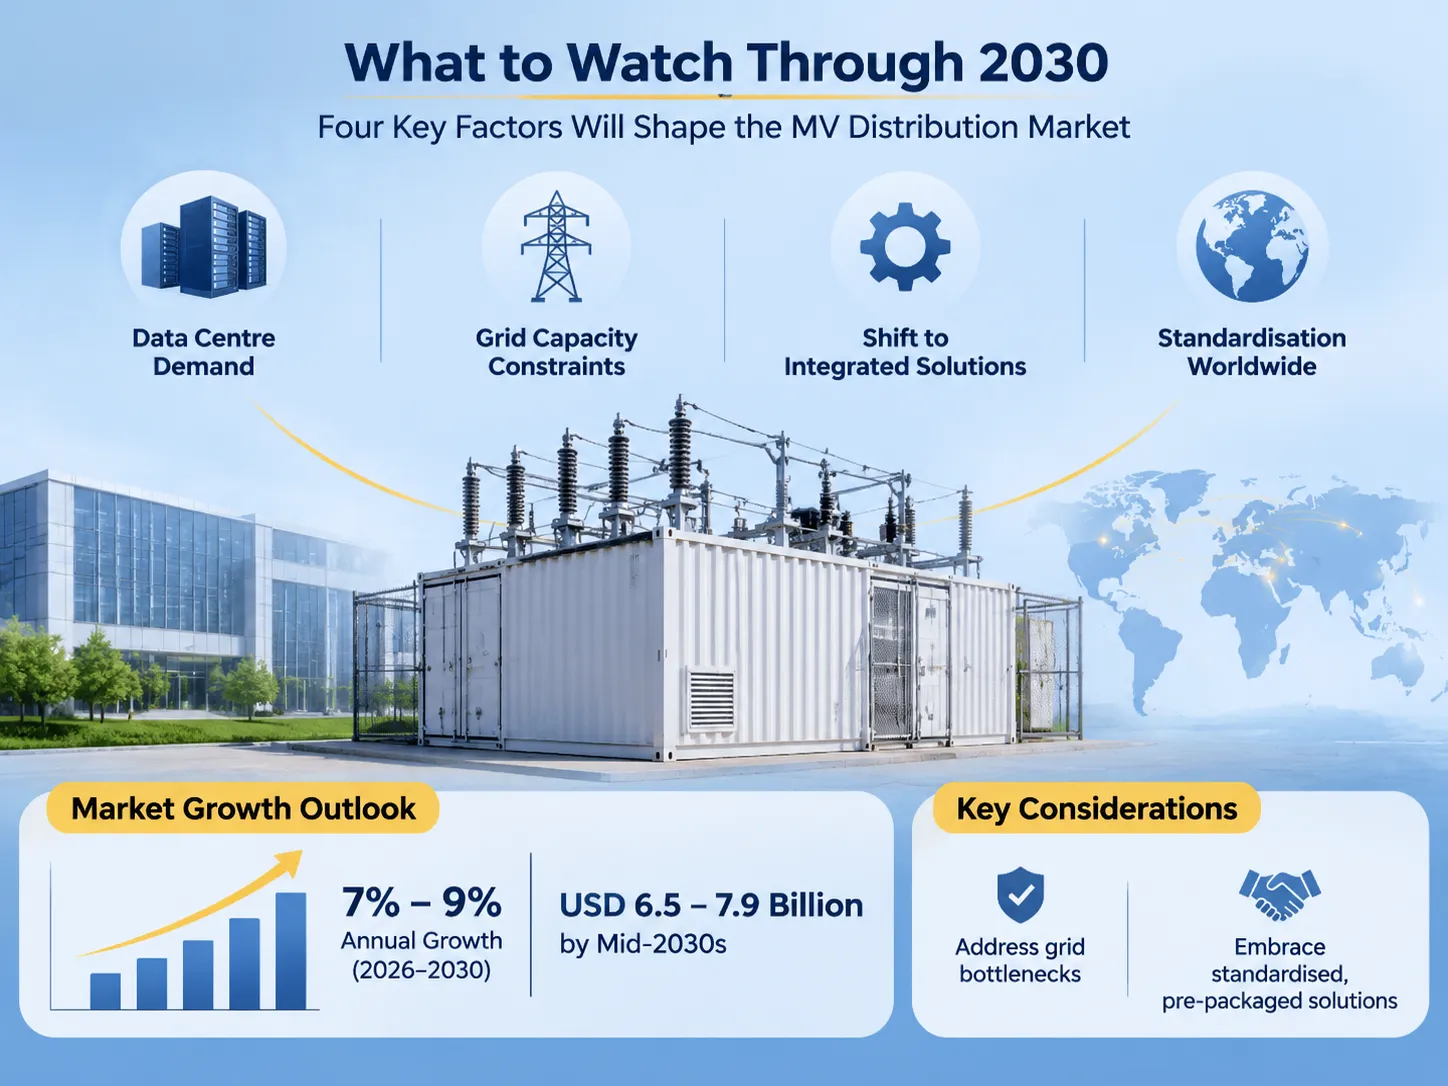
By 2030, the continued state of the medium voltage distribution market will be driven by the following four factors, with only three factors visible in the data to date:
The following areas are potential barriers to developing a sizable global containerized substation market:
- Daily growth of the data centre segment exceeds expectations according to most specialised publications. This suggests that the average size of a data centre will continue to increase, leading to a decrease in the number of smaller manufacturing facilities that supply to the sector. This is due to the fact that a typical 100 MW data centre buyer does not typically use a product catalogue for purchasing.
- There is insufficient capacity on the electrical grid to support large scale data centre development. A significant number of proposed data centres are currently experiencing construction delays due to the limited capacity of the grid. Therefore, product availability to shorten construction is not likely to have any effect on the length of time it takes to complete the necessary studies to obtain a construction permit. This situation will likely serve to limit the ability to grow in high-demand markets.
- There is a major transition from the sale of individual pieces of equipment to the sale of pre-packaged solutions. Recent reports indicate that approximately 50% of the data centre systems installed today are being monitored remotely. An even larger percentage (approximately 65%) of respondents to a recent survey indicated that they plan to increase their investment in remote monitoring solutions. As such, customers will be purchasing uptime and reporting, as opposed to buying the actual hardware.
- Countries are moving toward adopting standards. Each country has its own MV standard voltage. Each country also has its own MV design philosophy and each country has its own route of approval. A manufacturing operation that can offer three or four configurations in tooling will have a competitive advantage over an operation that is developing a new configuration for every order. The international comparison of substations provides examples of how these configurations vary throughout the world and represents the pragmatic continuation of this movement toward standardisation.
A market report released over the fall of 2026 predicted between USD 3.3 billion and USD 3.5 billion in revenue, a narrower definition placing it closer to USD 1.3 billion. In 2026, the annual growth forecast is expected to be between 7 per cent and 9 per cent with values at mid-2030s ranging from USD 6.5 billion to USD 7.9 billion depending on the scope.
Часто задаваемые вопросы
Why are there contradictions among the size of the market in certain reports?
Market reports disagree with one another because they define the product differently: some are based on equipment revenue, whereas others include the delivered packaged product, including all protection, auxiliaries and testing. Some count large volumes of prefabricated buildings, whereas others count cargo crates and skids. The growth rate between market reports is more closely aligned than the total value.
Which region is experiencing the most growth?
China is experiencing the most rapid growth at approximately 11.5 per cent annually through 2036, followed by India at about 10.7 per cent. Both regions are ‘growing out’ rather than ‘replacing’ existing grids, which allows factory-built units to offer the fastest delivery times. While the United States is the slowest growing region among large markets and the growth is expected to be approximately 7.2 per cent, it is also a large market based on the financial value of its units being larger.
Are data centres currently driving the growth of the containerized substation market?
Currently, data centres are the fastest growing application for containerised substations; however, data centres are not yet the largest segment in the published tables. Published tables report renewable integration accounts for approximately 46 per cent of total sustained demand. The electricity consumed by data centre demand is found in the electricity statistics: a projected 415 TWh of electricity consumption in 2024 increasing to around 945 TWh in 2030, with approximately 45 per cent of consumption occurring within the United States.
What is the typical size substation that is packaged as a containerised substation?
The majority of packages will typically be less than 25 MVA and most packages will have a volume rating of less than 10 MVA. When packages exceed 25 MVA they become prefabricated buildings, and when they exceed 100 MVA they become E-Houses which are custom designed and assembled on site. The per MVA price will cease to fall at this transition.
What is the lead time to receive a containerised substation package?
Lead times for containerised substation packages will vary between twelve and twenty weeks for standard 1 to 2.5 MVA distribution packages, as the transformer and switchgear are catalogue products. Lead times for Utility Specification Containerised Substation packages will be six to nine months, and the reason for this delay is due to the need for customised protection and completion of engineering approvals versus actual production timelines.
Ссылки
- Future Market Insights — Containerized Substation Market
- The Insight Partners — Containerized Substation Market
- Reanin — Containerized Substation Market
- IEA — Energy and AI
- Hitachi Energy — Grid and Substation Technology
Заключение
Рынок контейнерных подстанций прогнозируется как бизнес стоимостью от 3 до 4 миллиардов долларов США с ожидаемым темпом роста от 7% до 9%, однако расхождение между отчетами обусловлено тем, что они противоречат друг другу в определении одного и того же рынка, хотя основаны на схожих источниках данных. В настоящее время наибольшая доля дохода на рынке контейнерных подстанций приходится на интеграцию возобновляемых источников энергии, коммунальные предприятия и рынки среднего напряжения. Спрос со стороны дата-центров приведет к изменениям в текущих прогнозах.
For purchasers of containerised substations, it will be important to remember that the lead time for receipt is based on engineering approvals and not on factory capacity, and that the value of ratings under 10 MVA are the valued segments. In addition, that the specifications of a product, not its category, determines which two quotations can be compared against each other.