


In terms of the containerized substations market, it has seen substantial growth over the last six years (i.e., from a niche product to a typical response) but there has been a noticeable lag in relationship to actual market research on this product category. Three reports published in 2026, one from each of the three large consulting firms have each assigned the containerized substations market to the three different sizes: USD 1.3 billion, USD 3.3 billion, and USD 3.5 billion. The difference between these three estimates is not just slight rounding. Therefore, the better information for a buyer is understanding the differences in the areas of scope and estimates of the total.
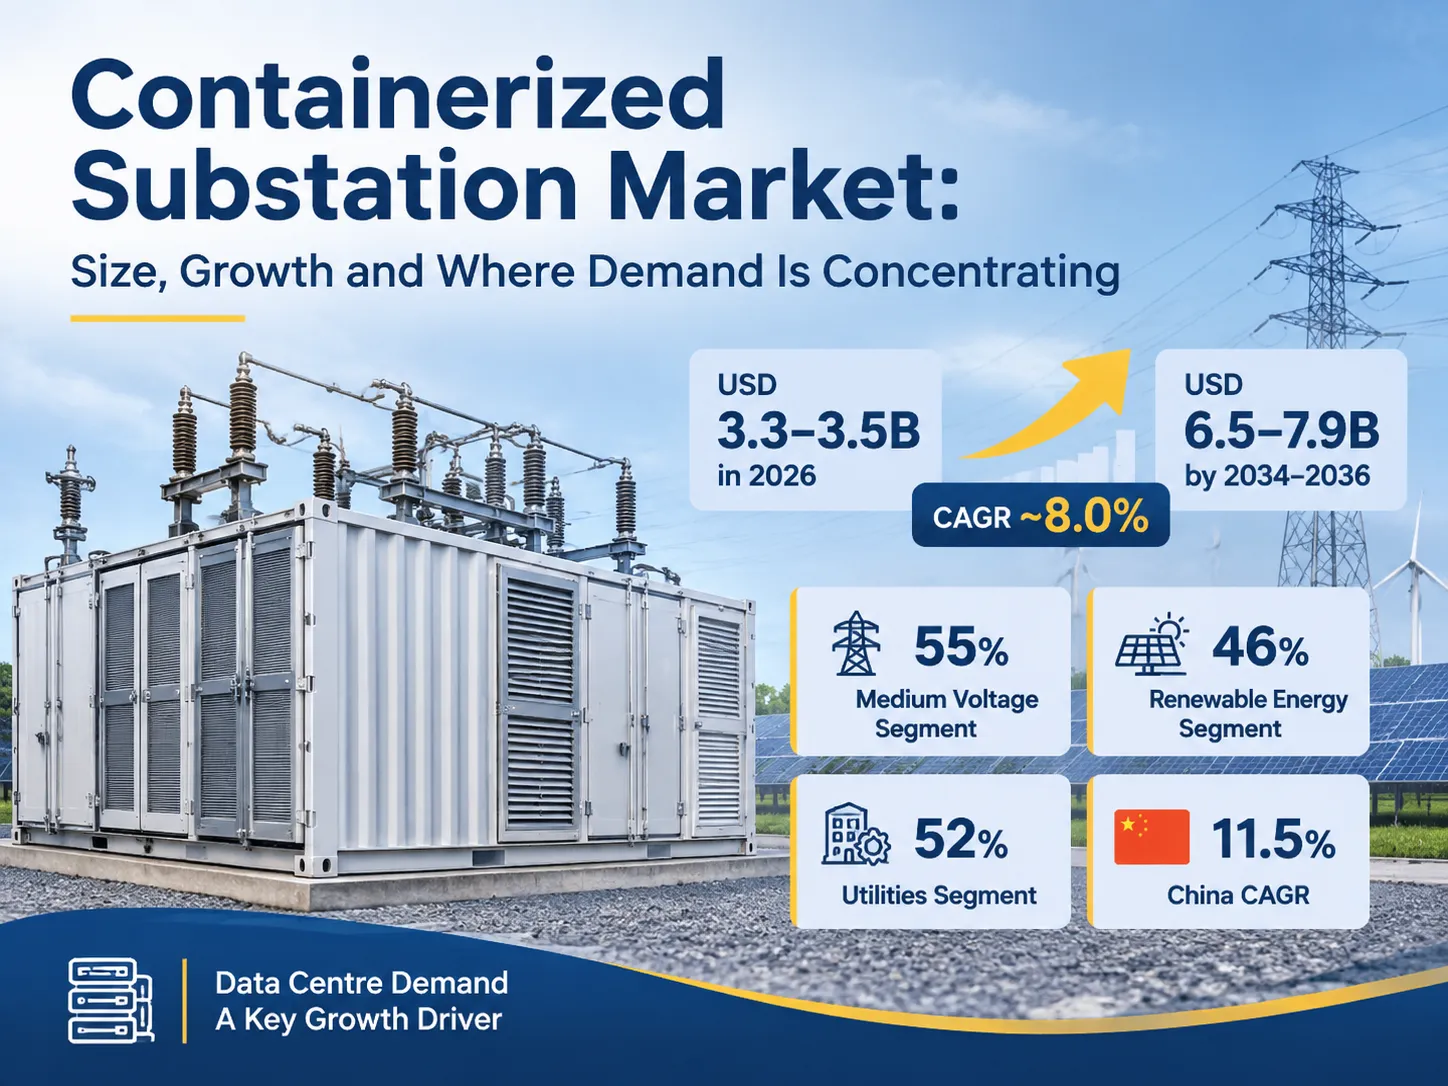
To simplify my earlier speculation, the overall size or value of the containerized substations market is estimated between USD 3.3 billion and USD 3.5 billion in 2026. The projected compound annual growth rate is approximately 8.0%, allowing this market to grow to a value between USD 6.5 billion and USD 7.9 billion by 2034 to 2036. Fifty-five percent (55%) of the expected revenue is expected to be derived from the medium voltage segment, while the largest segment of expected revenue will come from the renewable energy segment (46%) of total market revenue. Fifty-two percent (52%) will be derived from the utilities segment of the total market and the fastest growing country will be China, with a growth of 11.5% compounded annually, going forward. Data centre demand was not adequately considered by all 2021 forecasts.
Why Three Reports Give Three Different Numbers
The three reports published to date have all provided a forecast of future market growth. There is consistency across the reports in their forecasts for percentage growth but they disagree in the absolute size of the market. Consequently, all three reports are using differing methods of assessment. What is evident is that there will be continued market growth in the area of prefabricated and portable sub-distribution substations as a result of the speed at which new grid connections must be connected to enable increased demand, as shown in the graph below.
| Fonte | Base year value | Forecast value | CAGR | What is included |
|---|---|---|---|---|
| Future Market Insights | USD 3.20B (2025); USD 3.47B (2026) | USD 7.85B (2036) | 8.5% | Prefabricated Portable Subdistribution Substation Market |
| The Insight Partners | USD 3.27B (2025) | USD 6.56B (2034) | 8.04% | Same product line, segmented by MVA band including above 100 MVA |
| Reanin | USD 1.32B (2025) | USD 2.09B (2032) | 6.7% | More restricted definition, closer to skid mounted portable substations |
From the data presented above, we see a general consensus that the overall market for portable and prefabricated subdistributions today (2025) will be between $3B – $4B, with a corresponding market growth rate of approximately 7 – 9%. Reanin’s projection is roughly 1/3 of the other two reports; however, it is likely this is a result of Reanin’s exclusion of the larger prefabricated portable buildings and only counting the smaller packaged subdistributions that fall within the definition of containerized. This is the same product that most industrial buyers are using when they refer to containerized substations, therefore the smaller number is not incorrect, but a less broad understanding of the portable/prefabricated subdistribution market as it is represented in Reanin. For any individual buyer, the relevant information is the market segment(s) they are interested in, as opposed to the total market number.
A purchaser must ascertain if lead times are increasing, if the market segment they are purchasing is the primary segment taking on additional capacity and which countries provide competitive factory slot availability.
When Three Research Reports Describe the Same Product Differently
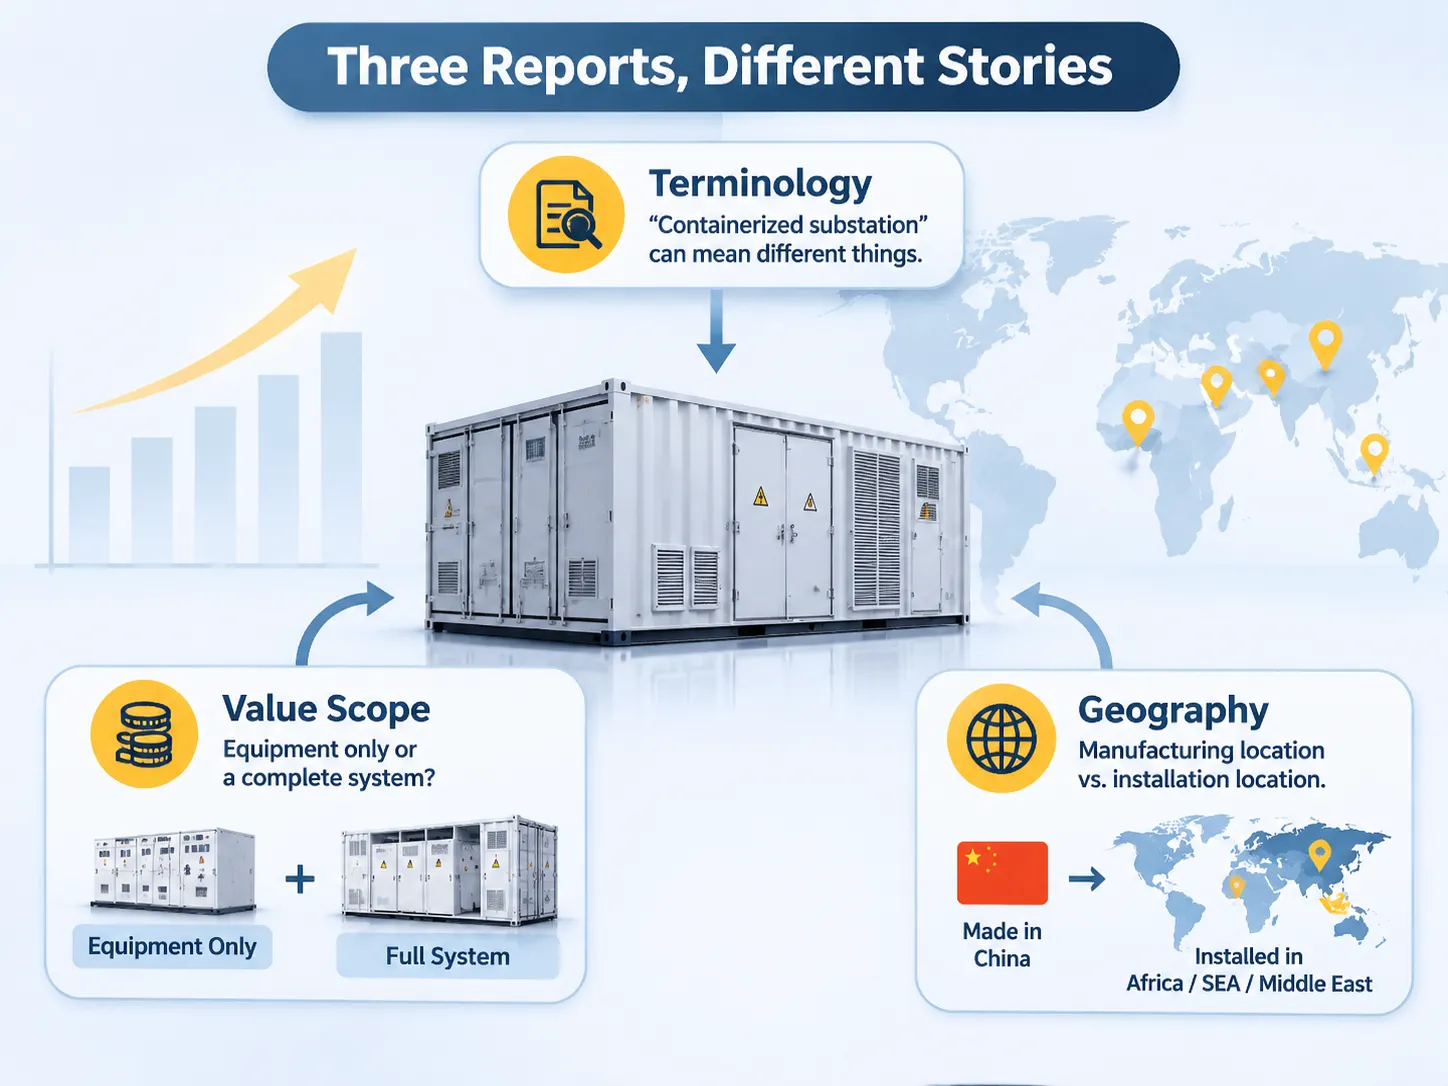
The discrepancy in terms used for these products presents the greatest obstacle in performing accurate market research on this product, followed closely by the quality of the data reported in the respective reports. The term “containerized substation” can be used to describe a variety of products that have very little in common besides the fact that they are shipped as a “container.” In addition to being sold by various companies as a containerized substation, various manufacturers also define the product in different ways.
Another pivotal point to differentiate among the three reports is the means by which they determine which value of the substation is counted. For example, substation revenue generated from equipment only versus that of a complete system (with auxiliary, protection, HVAC and fire suppression) can cause significant variances within the three reports. Substations delivered as a tested assembly command between three and five times the value of the substation equipment alone due to the inclusion of all necessary components within the tested unit and therefore, a report that captures only equipment revenue will provide a substantially lower revenue number than one that captures total system revenue.
Lastly, the geographic difference between the geographic locations of manufacture and installation leads to enormous discrepancy between these three reports. For instance, a significant percentage of containerized substations being installed in the cities of Africa/Southeast Asia/Middle East are produced in the country of China. Therefore, a report representing country of installation would capture a substantial amount of market share occurring in these regions while a second report representing country of manufacture would show comparatively lower percent of market share.
What Counts as a Containerized Substation, and What Does Not
A Container -Substation is described in this document as a factory assembled and tested substation that is shipped to site as one unit (or possibly two or more units) that will be wired (but not assembled) at site location to provide utility service to customers. The Compact Substation Configurations Reference guide defines the kinds of enclosures that meet that definition, including a Versatile Single-transformer Kiosk to a Walk-in Package with an LV room.
What is Not a Containerised Substation?
A Containerised Substation definition will include the enclosure types below, i.e.; however, a standard Substation Building built with Poured Floors and Masonry Walls does not meet the Containerised Substation definition even if the Switchgear arrives in Complete Modules. A Mobile Generator enclosed in a standard Container does not meet the Containerised Substation definition. A Containerised Package Substation with no Switchgear (just transformers inside enclosures) usually will be counted as a Transformer Product rather than a Substation.
For the buyer, this creates a practical issue, as the prices that suppliers provide will generally be incomparable, e.g.; one supplier quoting a “1,000 kVA Containerised Substation” may be quoting a Transformer packaged in a Container, whereas a second supplier may provide a Complete Package including Protection, Metering, Auxiliaries, Documented and Tested Report (Routine). Therefore, it is critical that the Specification states specifically the Scope of Work and not a Product Category.
Growth by Country, and What Is Actually Driving It
2026 Country Growth Rates are an actionable part of the research report since they identify where Demand for all Substation Equipment and Services is focusing, rather than identifying where the Demand is now located (it shows where Demand is estimated to be in 2026).
| Paese | CAGR 2026 to 2036 | What is driving it |
|---|---|---|
| Cina | 11.5% | Industrial park electrification inland Utility scale solar and wind connection Mining electrification western provinces Export demand into Africa and SE Asia |
| India | 10.7% | National Solar Mission Rural Electrification Smart Cities Programme Distribution Modernisation |
| Germania | 9.8% | Energiewende grid connection requirements include wind and storage, Energy security. |
| Francia | 8.9% | Renewables will fill gaps created when Nuclear Power stations shut down. France has planned Rail Electrification Corridors |
| United Kingdom | 8.1% | Offshore Wind Land Fall Substations. A must for Grid Stability and backup during storms and emergency situations; mobile unit production will assist in areas lacking access to the grid. |
| USA | 7.2% | The Distribution of Data Centres is driving Utility Grid Modernisation and the creation of a Storm Resilient Utility Grid in the US. |
| Brasile | 6.4% | Hydro and solar plants connected to the grid, industrial clusters’ ability to export. |
The pattern is that where the grid is extended and not replaced (new factories using prefabricated units) there is more rapid growth than for markets that have mature grids with more mature & complex products. Thus, while the US market is still one of the two biggest in value, it has had the slowest growth rate on this list.
The most frequently cited limiting factors (as opposed to drivers) according to this particular report and other similar reports are Permitting and Interconnection Queues, in this order. This is consistent with what Commercial Companies see. The Equipment itself is rarely considered to be the long pole, whereas it is the Grid Connection Studies that are.
Data Centres: The Demand Line Nobody Modelled in 2020
In 2021, the reports listed the following four markets as Renewable Energy Mines, Temporary Supply Energy and Disaster Recovery. Data centers were not included in previous projections as populated by the IEA through 2026, but have since changed to explain the rise in data center forecasts, with currently still published Segments Tables showing Renewable Energy as the largest category.
Evidence of this can be found in electricity consumption numbers. The IEA predicts global electric consumption from data centers to reach 415 TWh (approximately 1.5% of total global electric consumption) within 2024, while projecting over 2X increase in electric consumption from data centers to approximately 945 TWh by 2030. Approximately 45% of global electric consumption will be attributable to data centers and the anticipated electric demand growth from data centers is estimated to comprise approximately 50% of all electric demand growth in the U.S. during this same time period.
The implications for this product are as follows: Hyperscale campuses require 100 MW of electricity and above – to be delivered in phases. In addition, the medium voltage distribution for each phase must be separated and metered from each other. A containerised substation can be ordered and factory tested and energized within months; it can also be reused at another site once the initial site has been developed and ready for use. The primary advantage of this approach is based on schedule and there’s no monetary value associated with this product; it is what data center clients wish to purchase.
There are similarly specific constraints associated with this product. The IEA estimates that 20% of planned data center developments will be subject to delays due to insufficient grid connections. At present, substation packages do not eliminate the queue for.
Source: IEA World Energy Outlook 2023, JLL.
The two major applications for the current generation of substations are renewable integration (46.2% of total sales by 2026) and mining (2nd plus extreme requirements). Structural reasons support why the largest revenue generator for renewable integration is solar farms (which typically are located in remote locations with no roads or buildings). To accommodate this characteristic, a complete substation must be supplied at the time of the farm’s construction.
While a wind farm has similar characteristics as a solar farm, the multiple collection points of a wind farm create additional challenges when supplying substations.
Mining substations represent the second largest revenue stream and have the most extreme requirements of any substation type. Mining sites are mobile, and therefore substations must also be mobile. For example, a mining substation located at 2,000 metres above sea level causes the switchgear to derate and alters the creepage distances.
Also, due to the dominant load of large drives used in mining operations, harmonic distortion and a specification stating the short-circuit current must be included.
Finally, the two remaining types of station are temporary supply and disaster recovery.
Temporary supply and disaster recovery are both used for temporary purposes; however, they differ from the other two applications’ customers because their customers are typically either a utility or a rental company rather than a project developer.
When mobility is a key consideration of prefabricated outdoor substations, specifications for these units must reflect that characteristic.
Voltage Mix and the Rating Bands Buyers Order
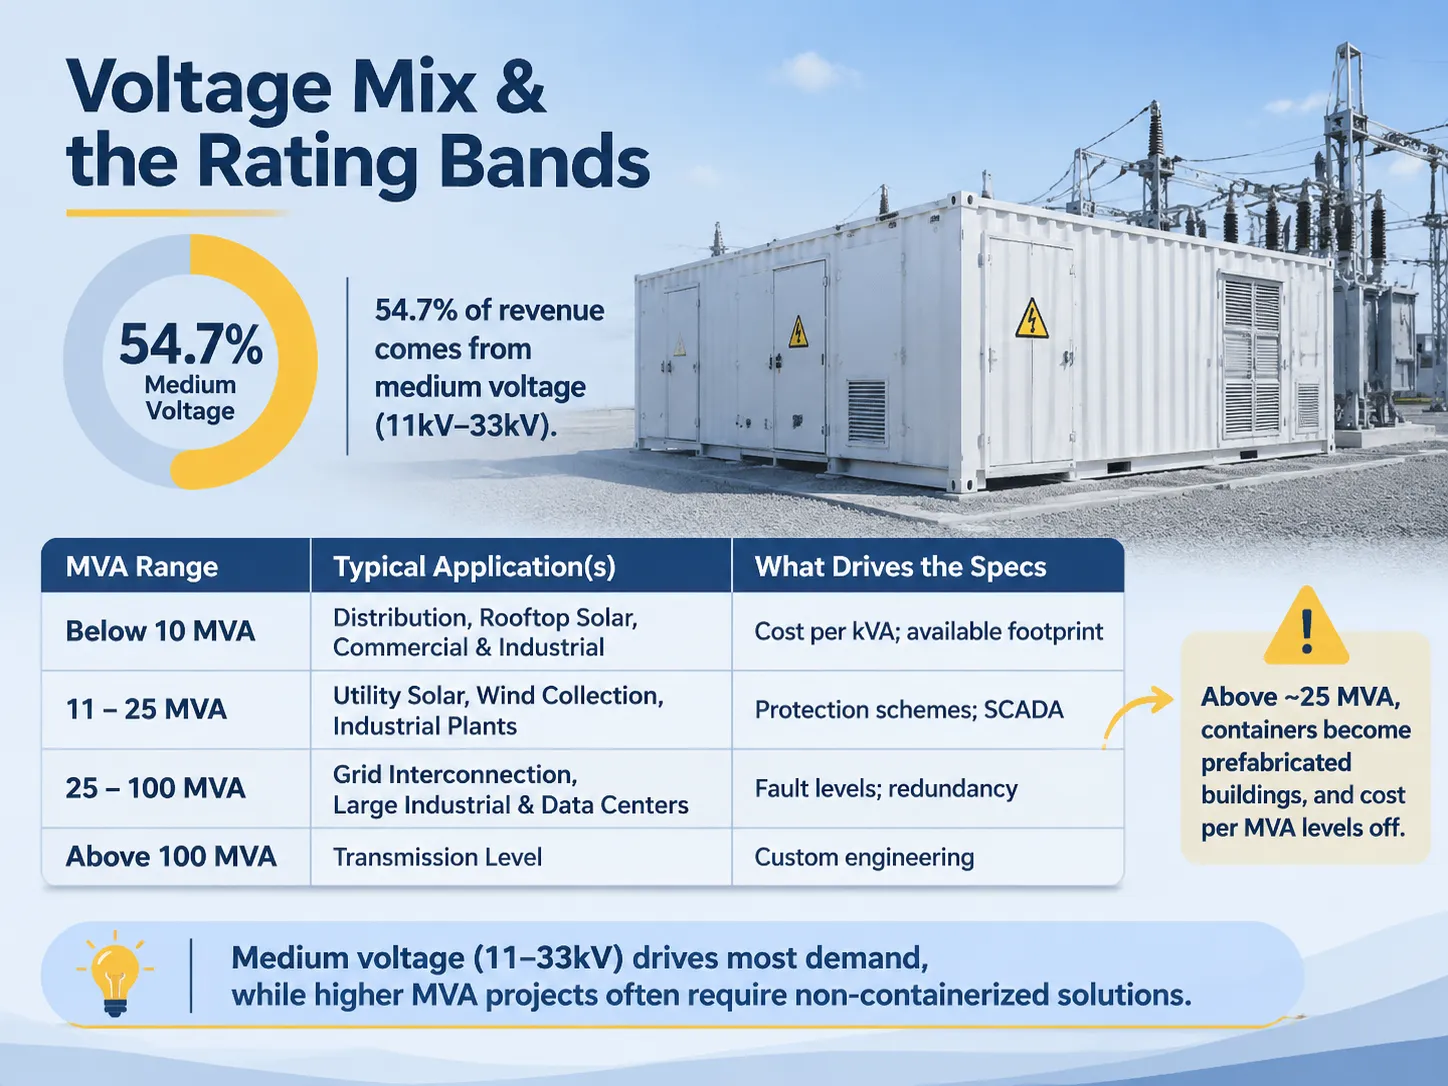
54.7% of total revenue will be generated by medium voltage, which is consistent with what will be installed. Most containerized substations are rated 11kV, 22kV, or 33kV on the primary side and 400V or 480V on the secondary side, because it is more economical to construct a factory-built package in this voltage band than it is to build a factory.
The segmentation of MVA used for research publications provides a better approximation of the actual items sold than voltage split by segmenting the market by application almost exactly.
| MVA range | Typical application(s) | What drives the specs |
|---|---|---|
| Below 10 MVA | Distribution, Rooftop and Ground-Mounted Solar, Commercial and Industrial Facilities | Cost per kVA; available foot print; standardized enclosures. |
| 11 to 25 MVA | Utility Scale Solar Blocks, Wind Collection, Industrial Plants | Protection schemes; SCADA; harmonic distortion limits. |
| 25 to 100 MVA | Interconnection to the grid, Large Industrial and Data Center Complexes | Fault levels; redundancy; metering; compliance. |
| Above 100 MVA | Transmission Level, Generally Not Containerized Unless Used as an E-House | Custom engineering; transport limits; assembly on-site, etc. |
When MVA is above approximately 25 MVA, containers no longer qualify as products but become buildings designed for prefabrication. At that point, the cost per MVA trend begins to level off, so specifiers should be aware of this limitation when making assumptions about continuing economies of scale beyond this range.
Who Is Winning: Tiers, Names and Regional Strength
The competitive landscape can be viewed in three tiers, though no sample market shares have been released. Tier One are global electrical leaders; Tier Two are large regional manufacturers; Tier Three includes a long list of national factories and specialty manufacturers.
Tiers One — ABB, Siemens Alliance, Siemens Energy, Eaton, Schneider Electric and GE. Their advantage lies in the product inside the container: the protection and control systems, the type test documentation, and the utility writing specifications based on their equipment is less contentious than challenges to those specifications. Companies such as Toshiba, Larsen & Toubro, Kirloskar, Crompton Greaves, IMESA, Elsewedy, Meidensha, Powell and Qingdao TGOOD are all examples of manufacturers that fall into Tier Two. Each of these Tier Two manufacturers has a large presence in their respective home geographies as well as in the different market segments that tier two sets the standards for.
Most projects are completed in tier three. This is not a weakness of the tier three market. For example, a 2 MVA distribution package for a solar farm located in Southeast Asia will not require a global protection platform. It will need to contain a compliant transformer, a type tested ring main unit, a documented routine test that covers both the Transformer and Ring Main Unit, and a delivery date.
The elements of the monitoring layer form the basis of the competition in tier three. About half of all new installations now include some form of remote monitoring for the temperature, partial discharge trends, and breaker status information as standard features; this is what the intelligent integrated substation range provides. Although a small additional expense to the package, the intelligent integrated substation capability represents a significant increase to the service contract’s costs and is therefore being adopted by tier three suppliers at a significantly faster rate than their tier one counterparts. In addition, two recent product announcements illustrate the competing priorities between the major manufacturers as they pursue growth. In June 2023, Schneider released its containerized microgrid solution aimed at integrating renewable energy resources off the grid. In October 2022, Siemens Energy introduced a containerized substation for access into emerging markets, especially Africa. Both manufacturers have recognised this is where the bottleneck exists within the grid’s connection to each company’s product offerings.
What the Market Data Does Not Tell a Buyer
The most important piece of information that a buyer needs to know before they look to purchase is the price per MVA, which is not provided in any of the summaries available to the public. The only information currently available to buyers is the pricing range of the different packages that include Transformer, MV Switchgear, LV Distribution, and Basic Protection Packages, which appear to average USD $80,000 – 200,000 for a 1 MVA and USD $500,000 – 1.2 million for a 10 MVA. The difference in prices within each category reflects the scope of work involved, as opposed to the profit margin for any individual company.
Another significant piece of information that is missing from the published data is the estimated lead time for equipment delivery. A 1 to 2.5 MVA standard distribution package will generally be available 12 – 20 weeks after placing a factory order with the manufacturer, primarily because the Transformer and Ring Main Unit are standard catalogue products. However, an End-User Utility specification with a custom protection scheme and factory witness testing and a defined short circuit study will take between 6 – 9 months to complete, primarily due to the need for Engineering Approval rather than the time involved in the manufacturing process.
The last important piece of data missing from the published market data is the site development cost associated with the equipment that the Buyer is attempting to replace with a containerised solution. The containerised solution will still require a foundation, cable trench, earth grid and connection agreement. Based on the Manufacturer’s claims, the site development costs and resulting speed of installation of a containerised solution are, in fact on average, 25 – 30% lower in comparison to building a brick structure, but this comparison is misleading. The comparison being made in the published data is to a fully functional transformer that is located on a foundation.
Where Subian Fits in This Market
Subian provides the majority of our volume when it comes to medium voltage distribution packages that range from several hundred kVA to approximately 10 MVA. Our packages can be supplied in both an enclosure-type box structure or as a containerized assembly, which includes the distribution transformer and all required MV and LV switchgear and LV distribution components pre-assembled and factory-tested prior to leaving the manufacturing facility. This accounts for approximately 54.7 percent of the overall market as discussed in this report, and it is where the factory with a dedicated transformer manufacturing facility has an advantage over integrators who do not have this capability and must purchase the transformers.
Subian’s offering in the distribution transformer and substations includes all standard configuration options: 11, 22 and 33 kV primary voltage, 400 to 480 volts secondary voltage, ONAN or ONAF cooling, and enclosure options available in painted steel, galvanized steel, or stainless, depending on where the equipment will be located. Subian’s employees configure the monitoring systems for each customer based on their specific requirements. Therefore, there is no “standard” for monitoring configurations, since it is likely that a mining customer who has no communication link will not wish to purchase telemetry that he/she cannot use.
Subian does not position itself to compete with the larger tier one providers; to do so would result in wasted resources for both sides. If a project specification requires any of the following: a global protection scheme, a specific type of relay, or a utility-type test certificate, the tier one providers will provide a superior product to Subian, therefore we would expend resources unnecessarily for both parties by quoting on this type of project. Conversely, when a project specification is performance-driven, the same type of performance rating is available at a different cost and lead time.
What to Watch Through 2030
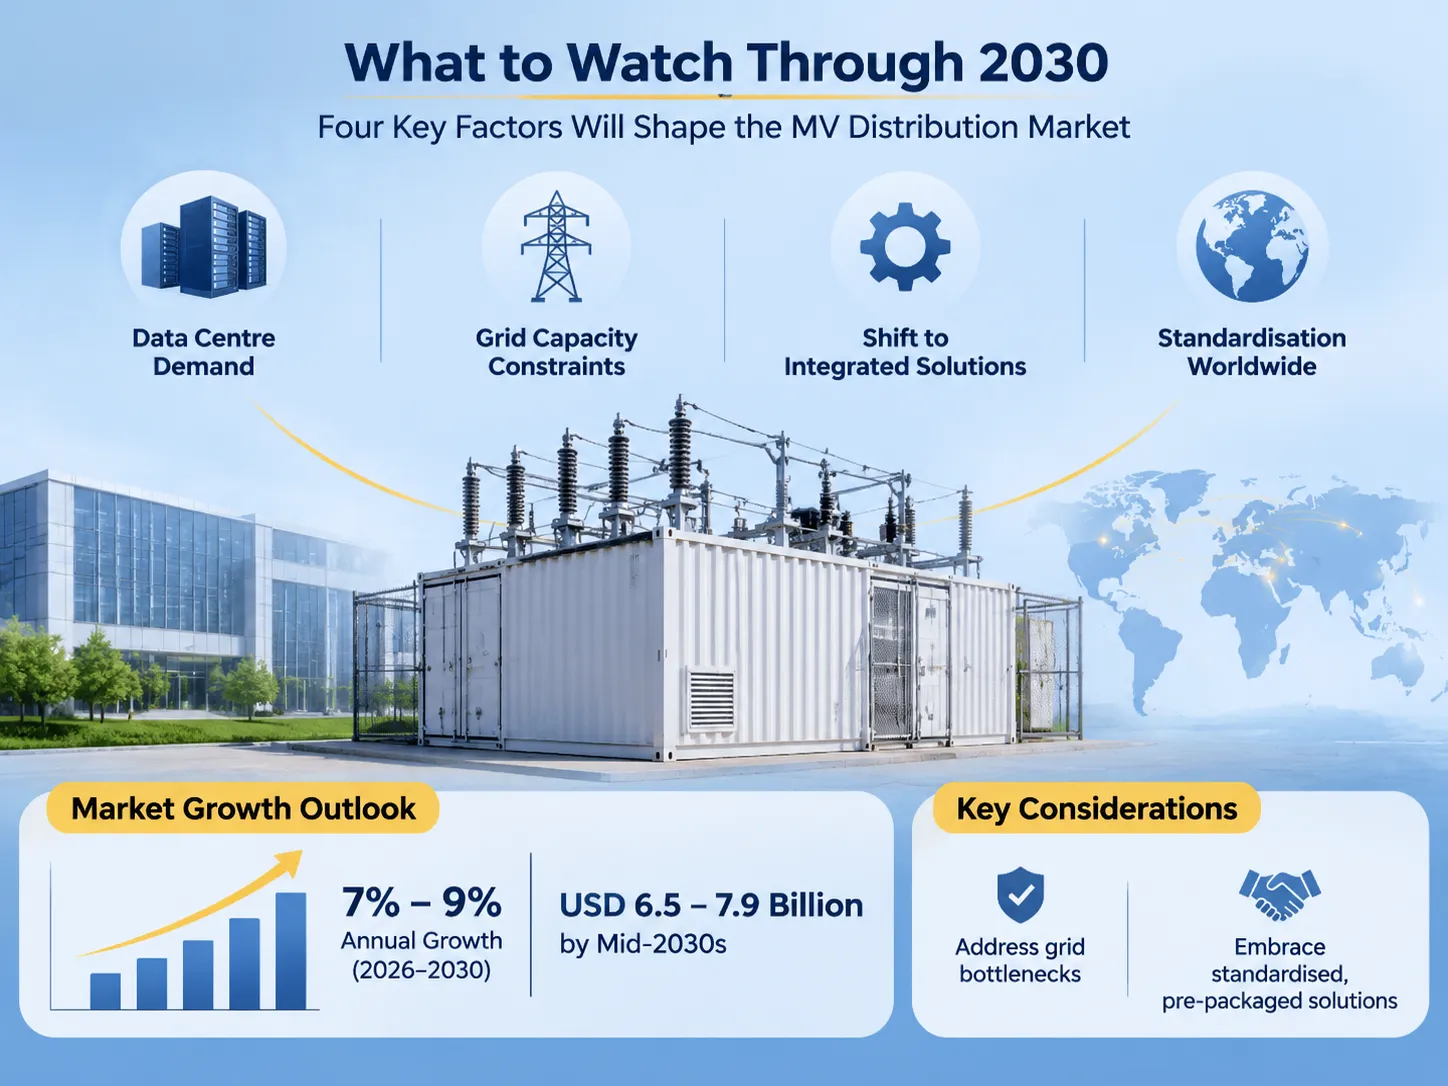
By 2030, the continued state of the medium voltage distribution market will be driven by the following four factors, with only three factors visible in the data to date:
The following areas are potential barriers to developing a sizable global containerized substation market:
- Daily growth of the data centre segment exceeds expectations according to most specialised publications. This suggests that the average size of a data centre will continue to increase, leading to a decrease in the number of smaller manufacturing facilities that supply to the sector. This is due to the fact that a typical 100 MW data centre buyer does not typically use a product catalogue for purchasing.
- There is insufficient capacity on the electrical grid to support large scale data centre development. A significant number of proposed data centres are currently experiencing construction delays due to the limited capacity of the grid. Therefore, product availability to shorten construction is not likely to have any effect on the length of time it takes to complete the necessary studies to obtain a construction permit. This situation will likely serve to limit the ability to grow in high-demand markets.
- There is a major transition from the sale of individual pieces of equipment to the sale of pre-packaged solutions. Recent reports indicate that approximately 50% of the data centre systems installed today are being monitored remotely. An even larger percentage (approximately 65%) of respondents to a recent survey indicated that they plan to increase their investment in remote monitoring solutions. As such, customers will be purchasing uptime and reporting, as opposed to buying the actual hardware.
- Countries are moving toward adopting standards. Each country has its own MV standard voltage. Each country also has its own MV design philosophy and each country has its own route of approval. A manufacturing operation that can offer three or four configurations in tooling will have a competitive advantage over an operation that is developing a new configuration for every order. The international comparison of substations provides examples of how these configurations vary throughout the world and represents the pragmatic continuation of this movement toward standardisation.
A market report released over the fall of 2026 predicted between USD 3.3 billion and USD 3.5 billion in revenue, a narrower definition placing it closer to USD 1.3 billion. In 2026, the annual growth forecast is expected to be between 7 per cent and 9 per cent with values at mid-2030s ranging from USD 6.5 billion to USD 7.9 billion depending on the scope.
FAQ
Why are there contradictions among the size of the market in certain reports?
Market reports disagree with one another because they define the product differently: some are based on equipment revenue, whereas others include the delivered packaged product, including all protection, auxiliaries and testing. Some count large volumes of prefabricated buildings, whereas others count cargo crates and skids. The growth rate between market reports is more closely aligned than the total value.
Which region is experiencing the most growth?
China is experiencing the most rapid growth at approximately 11.5 per cent annually through 2036, followed by India at about 10.7 per cent. Both regions are ‘growing out’ rather than ‘replacing’ existing grids, which allows factory-built units to offer the fastest delivery times. While the United States is the slowest growing region among large markets and the growth is expected to be approximately 7.2 per cent, it is also a large market based on the financial value of its units being larger.
Are data centres currently driving the growth of the containerized substation market?
Currently, data centres are the fastest growing application for containerised substations; however, data centres are not yet the largest segment in the published tables. Published tables report renewable integration accounts for approximately 46 per cent of total sustained demand. The electricity consumed by data centre demand is found in the electricity statistics: a projected 415 TWh of electricity consumption in 2024 increasing to around 945 TWh in 2030, with approximately 45 per cent of consumption occurring within the United States.
What is the typical size substation that is packaged as a containerised substation?
The majority of packages will typically be less than 25 MVA and most packages will have a volume rating of less than 10 MVA. When packages exceed 25 MVA they become prefabricated buildings, and when they exceed 100 MVA they become E-Houses which are custom designed and assembled on site. The per MVA price will cease to fall at this transition.
What is the lead time to receive a containerised substation package?
Lead times for containerised substation packages will vary between twelve and twenty weeks for standard 1 to 2.5 MVA distribution packages, as the transformer and switchgear are catalogue products. Lead times for Utility Specification Containerised Substation packages will be six to nine months, and the reason for this delay is due to the need for customised protection and completion of engineering approvals versus actual production timelines.
Riferimenti
- Future Market Insights — Containerized Substation Market
- The Insight Partners — Containerized Substation Market
- Reanin — Containerized Substation Market
- IEA — Energy and AI
- Hitachi Energy — Grid and Substation Technology
Conclusione
Il mercato delle sottostazioni containerizzate è previsto raggiungere un valore compreso tra 3 e 4 miliardi di USD con un tasso di crescita atteso tra il 7% e il 9%, tuttavia, la discrepanza tra i rapporti è dovuta al fatto che si contraddicono a vicenda nella definizione dello stesso mercato pur basandosi su fonti di dati simili. Attualmente, la quota maggiore di ricavi nel mercato delle sottostazioni containerizzate proviene dall'integrazione delle energie rinnovabili, dalle utility e dai mercati a media tensione. La domanda dei data center provocherà cambiamenti nelle previsioni attuali.
For purchasers of containerised substations, it will be important to remember that the lead time for receipt is based on engineering approvals and not on factory capacity, and that the value of ratings under 10 MVA are the valued segments. In addition, that the specifications of a product, not its category, determines which two quotations can be compared against each other.