


~에 관하여 컨테이너화된 변전소 시장, 지난 6년간 상당한 성장을 보였으나(즉, 틈새 제품에서 일반적인 대응으로) 이 제품 카테고리에 대한 실제 시장 조사와 관련하여 눈에 띄는 지연이 있었습니다. 2026년에 발표된 세 개의 보고서 각각은 세 개의 대형 컨설팅 회사에서 컨테이너화된 변전소 시장을 세 가지 다른 규모로 평가했습니다: 13억 달러, 33억 달러, 35억 달러. 이 세 가지 추정치 간의 차이는 단순한 반올림 차이가 아닙니다. 따라서 구매자에게 더 나은 정보는 범위와 총 추정치의 차이를 이해하는 것입니다.
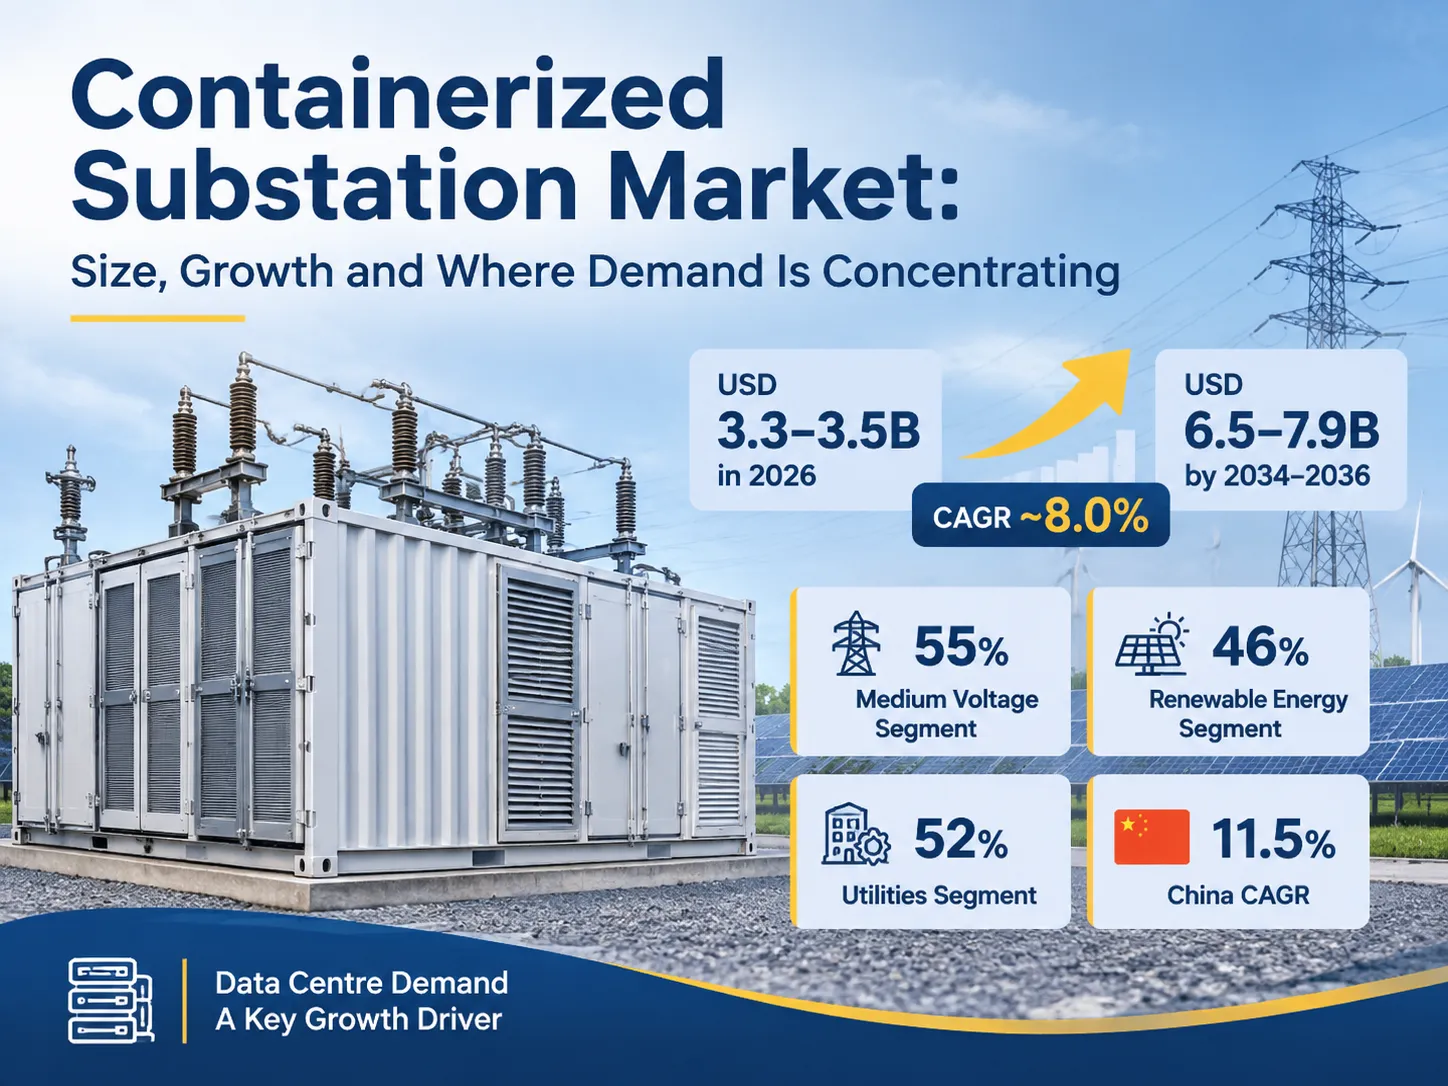
앞서 제기한 추측을 단순화하면, 컨테이너화된 변전소 시장의 전체 규모 또는 가치는 2026년에 33억 달러에서 35억 달러 사이로 추정됩니다. 예상되는 연평균 복합 성장률 은 약 8.01%로, 이 시장은 2034년에서 2036년 사이에 65억 달러에서 79억 달러 사이의 가치로 성장할 것으로 예상됩니다. 예상 수익의 55%(55%)는 중전압 부문에서 발생할 것으로 예상되며, 가장 큰 수익 부문은 전체 시장 수익의 46%(46%)를 차지하는 재생 에너지 부문에서 나올 것입니다. 전체 시장의 52%(52%)는 유틸리티 부문에서 발생하며, 가장 빠르게 성장하는 국가는 연평균 11.5%의 성장률을 보이는 중국이 될 것입니다. 데이터 센터 수요는 2021년 모든 예측에서 충분히 고려되지 않았습니다.
왜 세 개의 보고서가 세 가지 다른 수치를 제시하는가
지금까지 발표된 세 개의 보고서는 모두 미래 시장 성장에 대한 예측을 제공했습니다. 성장률에 대한 예측은 일관성이 있으나 시장의 절대 규모에 대해서는 의견이 다릅니다. 결과적으로 세 보고서 모두 평가 방법이 다릅니다. 명확한 점은 아래 그래프에서 보듯이, 새로운 그리드 연결이 증가하는 수요를 충족하기 위해 신속하게 연결되어야 하는 속도 때문에 조립식 및 휴대용 하위 배전 변전소 분야에서 시장 성장이 계속될 것이라는 점입니다.
| 출처 | 기준 연도 가치 | 예측 가치 | CAGR | 포함 항목 |
|---|---|---|---|---|
| Future Market Insights | 32억 달러 (2025); 34.7억 달러 (2026) | 5억 달러 (2036) | 8.5% | 조립식 휴대용 하위 배전 변전소 시장 |
| The Insight Partners | 7억 달러 (2025) | 6억 달러 (2034) | 8.04% | 동일 제품 라인, 100 MVA 이상을 포함한 MVA 밴드별 세분화 |
| Reanin | 2억 달러 (2025) | 9억 달러 (2032) | 6.7% | 더 제한된 정의, 스키드 장착 휴대용 변전소에 더 가까움 |
위에 제시된 데이터를 보면, 오늘날(2025년) 휴대용 및 조립식 하위 배전 시장의 전체 규모가 $3B – $4B 사이일 것이라는 일반적인 합의가 있으며, 이에 따른 시장 성장률은 약 7 – 9%로 예상됩니다. Reanin의 전망은 다른 두 보고서의 약 1/3 수준인데, 이는 Reanin이 더 큰 조립식 휴대용 건물을 제외하고 컨테이너화된 정의에 해당하는 더 작은 패키지형 하위 배전만을 집계한 결과일 가능성이 큽니다. 이는 대부분의 산업 구매자가 컨테이너화된 변전소라고 할 때 사용하는 동일한 제품이므로, 더 작은 수치가 틀린 것은 아니지만 Reanin에서 나타난 휴대용/조립식 하위 배전 시장에 대한 덜 광범위한 이해를 의미합니다. 개별 구매자에게는 전체 시장 규모보다는 관심 있는 시장 세그먼트가 더 중요한 정보입니다.
구매자는 리드 타임이 증가하고 있는지, 자신이 구매하는 시장 세그먼트가 추가 용량을 담당하는 주요 세그먼트인지, 그리고 어떤 국가가 경쟁력 있는 공장 슬롯 가용성을 제공하는지 확인해야 합니다.
세 가지 연구 보고서가 동일한 제품을 다르게 설명할 때
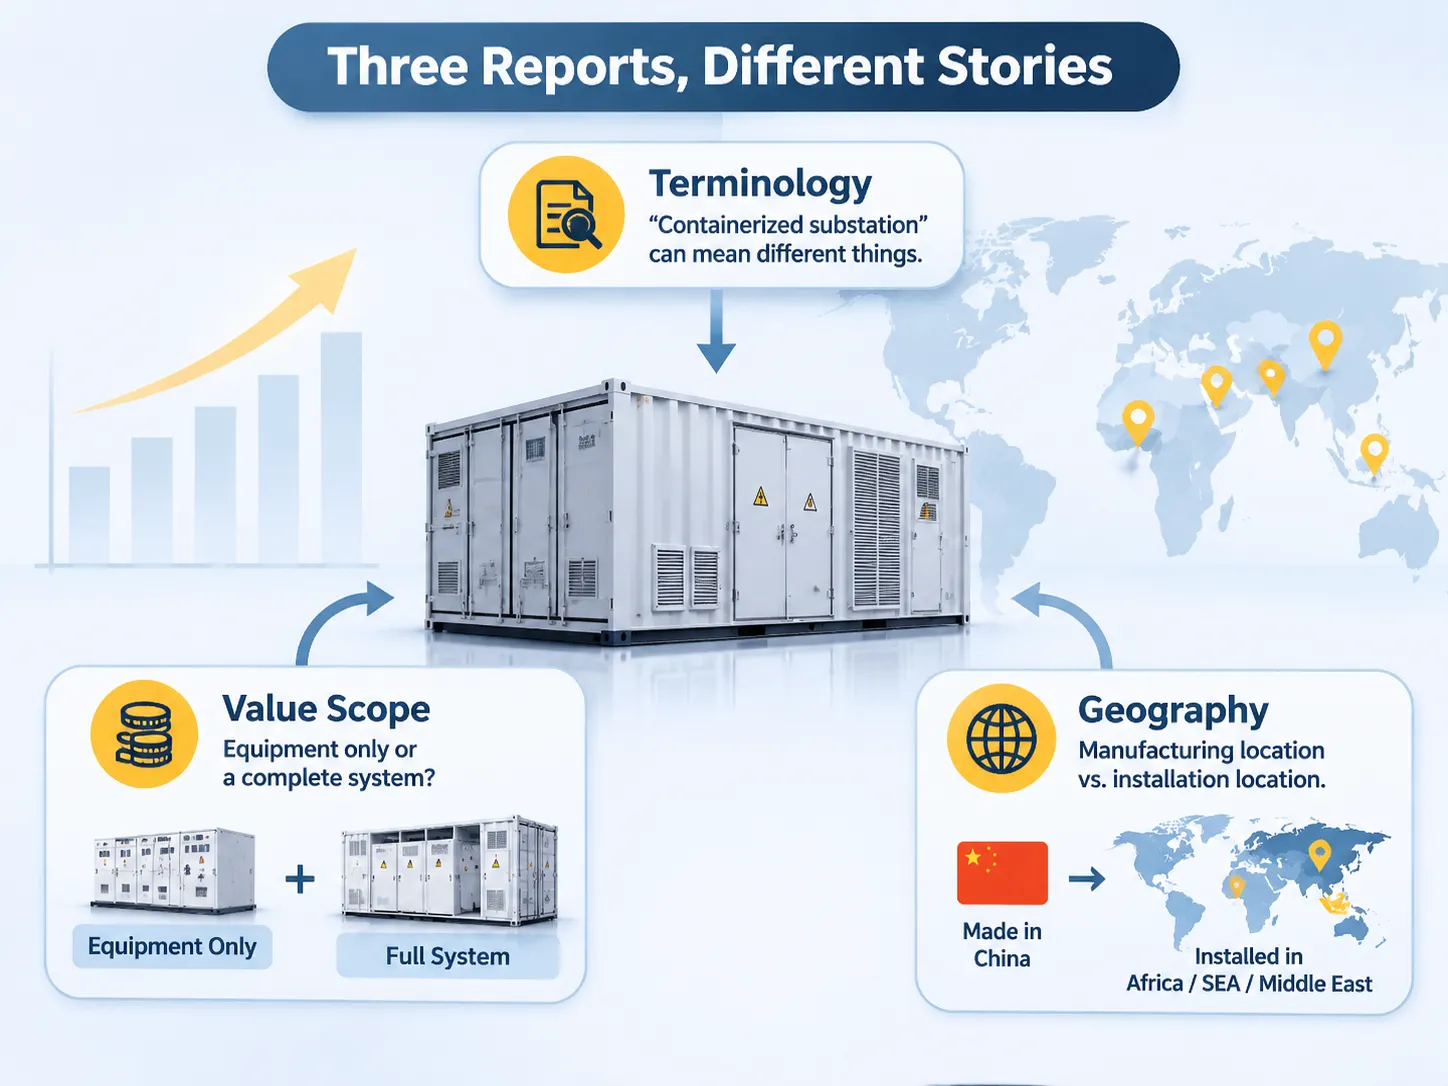
이 제품에 사용되는 용어의 불일치는 이 제품에 대한 정확한 시장 조사를 수행하는 데 가장 큰 장애물이며, 그 다음으로 각 보고서에서 보고된 데이터의 품질이 문제입니다. “컨테이너화된 변전소”라는 용어는 “컨테이너”로 운송된다는 점 외에는 거의 공통점이 없는 다양한 제품을 설명하는 데 사용될 수 있습니다. 여러 회사가 컨테이너화된 변전소로 판매하는 것 외에도, 다양한 제조업체가 제품을 다르게 정의합니다.
세 보고서 간 차이를 구분하는 또 다른 중요한 점은 변전소의 어떤 가치가 집계되는지 결정하는 방식입니다. 예를 들어, 장비만으로 발생하는 변전소 수익과 보조 장치, 보호 장치, HVAC 및 화재 진압 시스템이 포함된 완전 시스템 수익 간에는 세 보고서 간에 상당한 차이가 발생할 수 있습니다. 테스트된 조립품으로 제공되는 변전소는 필요한 모든 구성 요소가 포함되어 있기 때문에 변전소 장비 단독 가치의 3~5배에 달하는 가치를 지닙니다., 따라서 장비 수익만 집계하는 보고서는 전체 시스템 수익을 집계하는 보고서보다 훨씬 낮은 수익 수치를 제공할 것입니다..
마지막으로, 제조 및 설치 지리적 위치 간의 차이는 이 세 보고서 간에 엄청난 불일치를 초래합니다. 예를 들어, 아프리카/동남아시아/중동 도시들에 설치되는 컨테이너화 변전소의 상당 비율이 중국에서 생산됩니다. 따라서 설치 국가를 나타내는 보고서는 이 지역에서 발생하는 상당한 시장 점유율을 포착하는 반면, 제조 국가를 나타내는 두 번째 보고서는 상대적으로 낮은 시장 점유율을 보여줍니다.
컨테이너화 변전소로 간주되는 것과 그렇지 않은 것
본 문서에서 컨테이너화 변전소는 현장으로 하나의 유닛(또는 두 개 이상의 유닛)으로 출하되어 현장에서 배선만 하고(조립하지 않음) 고객에게 전력 서비스를 제공하는 공장 조립 및 시험 완료 변전소로 설명됩니다. 컴팩트 변전소 구성 참조 가이드 여기에는 다목적 단일 변압기 키오스크부터 LV 룸이 포함된 워크인 패키지까지 해당 정의를 충족하는 인클로저 종류가 정의되어 있습니다.
컨테이너화 변전소가 아닌 것은 무엇인가?
컨테이너화 변전소 정의에는 아래 인클로저 유형이 포함되지만, 스위치기어가 완전 모듈로 도착하더라도 바닥 타설 및 석조 벽으로 지어진 표준 변전소 건물은 컨테이너화 변전소 정의에 부합하지 않습니다. 표준 컨테이너에 수용된 이동식 발전기도 컨테이너화 변전소 정의에 부합하지 않습니다. 스위치기어가 없는 컨테이너화 패키지 변전소(인클로저 내 변압기만 포함)는 일반적으로 변전소가 아닌 변압기 제품으로 간주됩니다.
구매자에게 이는 실질적인 문제를 야기하는데, 공급자가 제공하는 가격이 일반적으로 비교 불가능하기 때문입니다. 예를 들어, 한 공급자가 “1,000 kVA 컨테이너화 변전소”를 견적할 때는 컨테이너에 포장된 변압기를 견적하는 반면, 두 번째 공급자는 보호장치, 계측, 보조장치, 문서화 및 시험 보고서(일상)를 포함한 완전 패키지를 제공할 수 있습니다. 따라서 명세서에는 제품 범주가 아닌 작업 범위를 구체적으로 명시하는 것이 중요합니다.
국가별 성장 및 실제 성장 동인
2026년 국가별 성장률은 모든 변전소 장비 및 서비스에 대한 수요가 어디에 집중되는지를 식별하므로 연구 보고서의 실행 가능한 부분입니다(현재 수요 위치가 아니라 2026년 예상 수요 위치를 보여줍니다).
| 국가 | 2026년부터 2036년까지 연평균 성장률(CAGR) | 성장 동인 |
|---|---|---|
| 중국 | 11.5% | 산업 단지 전력화, 내륙 유틸리티 규모 태양광 및 풍력 연결, 서부 지방 광산 전력화, 아프리카 및 동남아시아로의 수출 수요 |
| 인도 | 10.7% | 국가 태양광 미션, 농촌 전력화, 스마트 시티 프로그램, 배전 현대화 |
| 독일 | 9.8% | 에너지 전환(에너지벤데) 그리드 연결 요건에는 풍력 및 저장, 에너지 안보가 포함됩니다. |
| 프랑스 | 8.9% | 재생에너지는 원자력 발전소 폐쇄 시 발생하는 공백을 메울 것입니다. 프랑스는 철도 전철화 회랑을 계획했습니다. |
| 영국 | 8.1% | 해상 풍력 육상 접속 변전소. 폭풍 및 비상 상황 시 그리드 안정성과 백업을 위한 필수 요소; 그리드 접근이 어려운 지역에서는 이동식 유닛 생산이 지원됩니다. |
| 미국 | 7.2% | 데이터 센터의 분포는 미국에서 유틸리티 그리드 현대화와 폭풍 저항 유틸리티 그리드 구축을 촉진하고 있습니다. |
| 브라질 | 6.4% | 그리드에 연결된 수력 및 태양광 발전소, 산업 클러스터의 수출 능력. |
패턴은 그리드가 확장되고 교체되지 않는 곳(조립식 유닛을 사용하는 신규 공장)에서 성장이 더 빠르다는 것입니다. 성숙한 그리드 더 성숙하고 복잡한 제품을 가진 시장보다. 따라서 미국 시장은 여전히 가치 기준으로 두 번째로 큰 시장 중 하나이지만, 이 목록에서 가장 느린 성장률을 보였습니다.
이 특정 보고서 및 유사 보고서에 따르면 가장 자주 언급되는 제한 요인(성장 동인과 반대되는)은 순서대로 허가 및 상호 연결 대기열입니다. 이는 상업 기업들이 보는 바와 일치합니다. 장비 자체는 거의 주요 장애물로 간주되지 않으며, 그리드 연결 연구가 주요 장애물입니다.
데이터 센터: 2020년에 아무도 모델링하지 않은 수요선
2021년 보고서들은 다음 네 가지 시장을 재생 에너지 광산, 임시 공급 에너지 및 재해 복구로 분류했습니다. 데이터 센터는 2026년까지 IEA가 작성한 이전 예측에 포함되지 않았으나, 이후 데이터 센터 예측 증가를 설명하기 위해 변경되었으며, 현재 발표된 세그먼트 표에서는 재생 에너지가 가장 큰 범주로 나타납니다.
이 증거는 전력 소비 수치에서 확인할 수 있습니다. IEA는 2024년까지 데이터 센터의 전 세계 전력 소비가 415 TWh(전 세계 총 전력 소비의 약 1.5%)에 이를 것으로 예측하며, 2030년까지 데이터 센터 전력 소비가 약 945 TWh로 2배 이상 증가할 것으로 전망합니다. 전 세계 전력 소비의 약 45%가 데이터 센터에 귀속되며, 같은 기간 미국 내 전력 수요 증가분의 약 50%가 데이터 센터에서 발생할 것으로 추정됩니다.
이 제품에 대한 시사점은 다음과 같습니다: 하이퍼스케일 캠퍼스는 100 MW 이상의 전력을 단계별로 공급받아야 합니다. 또한 각 단계별 중전압 배전은 서로 분리되어 계량되어야 합니다. 컨테이너형 변전소는 주문 후 공장 테스트 및 가동까지 몇 달 내에 가능하며, 초기 부지가 개발되어 사용 준비가 완료된 후 다른 부지에서 재사용할 수 있습니다. 이 접근법의 주요 장점은 일정에 기반하며, 이 제품에는 금전적 가치가 부여되지 않습니다; 이는 데이터 센터 고객이 구매를 원하는 사항입니다.
이 제품과 관련된 특정 제약도 존재합니다. IEA는 계획된 데이터 센터 개발 중 20%가 그리드 연결 부족으로 인해 지연될 것으로 추정합니다. 현재 변전소 패키지는 대기열을 제거하지 못하고 있습니다.
출처: IEA 세계 에너지 전망 2023, JLL.
현재 세대 변전소의 두 가지 주요 적용 분야는 재생 에너지 통합(2026년까지 총 매출의 46.2%)과 광산업(2위 및 극한 요구사항)입니다. 구조적 이유로 인해 재생 에너지 통합에서 가장 큰 수익 창출원은 태양광 발전소이며(일반적으로 도로나 건물이 없는 외진 지역에 위치), 이러한 특성을 수용하기 위해 발전소 건설 시점에 완전한 변전소가 공급되어야 합니다.
풍력 발전소는 태양광 발전소와 유사한 특성을 가지지만, 풍력 발전소의 다중 집전 지점은 변전소 공급 시 추가적인 도전을 야기합니다.
광산 변전소는 두 번째로 큰 수익원이며 모든 변전소 유형 중 가장 극한의 요구사항을 가지고 있습니다. 광산 현장은 이동성이 있으므로 변전소도 이동 가능해야 합니다. 예를 들어, 해발 2,000미터에 위치한 광산 변전소는 개폐기의 정격을 낮추고 크리페이지 거리를 변경시킵니다.
또한, 광산 작업에 사용되는 대형 드라이브의 지배적인 부하로 인해 고조파 왜곡과 단락 전류 명세가 포함되어야 합니다.
마지막으로, 나머지 두 가지 변전소 유형은 임시 공급과 재해 복구입니다.
임시 공급과 재해 복구는 모두 임시 목적으로 사용되지만, 고객이 일반적으로 프로젝트 개발자가 아닌 유틸리티 또는 임대 회사라는 점에서 다른 두 적용 분야와 다릅니다.
이동성이 조립식 옥외 변전소, 의 핵심 고려 사항일 때, 이 장치의 명세는 해당 특성을 반영해야 합니다.
전압 혼합 및 정격 밴드 구매자 주문
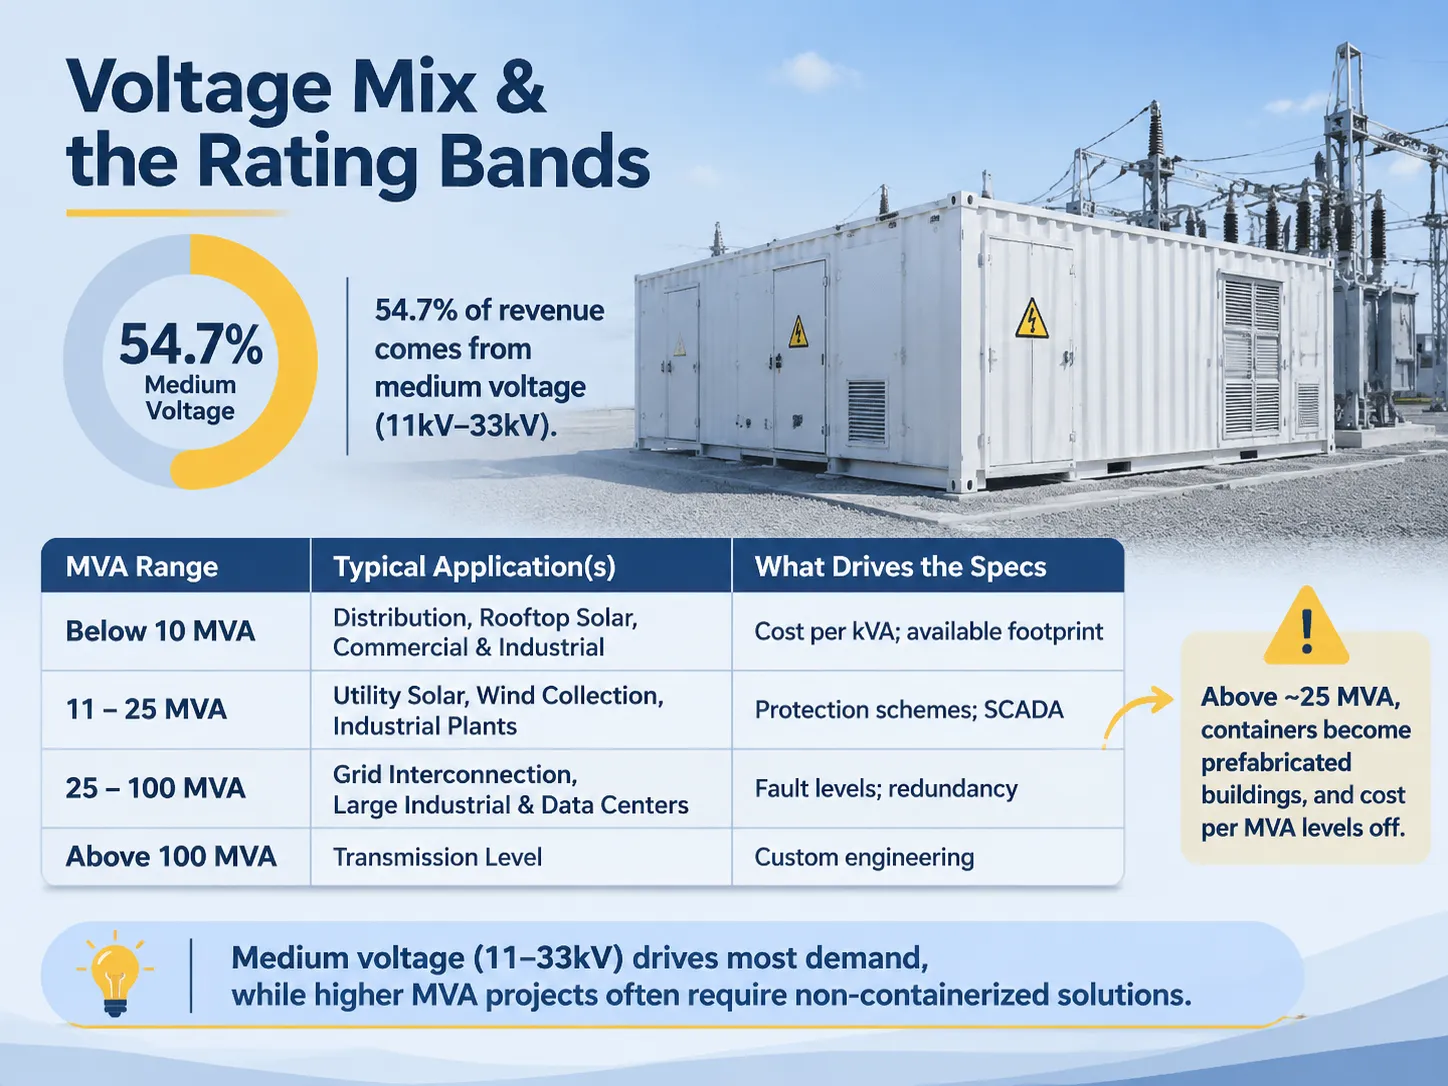
총 매출의 54.7%는 중전압, 에서 발생하며, 이는 설치될 전압과 일치합니다. 대부분의 컨테이너형 변전소는 1차 측에서 11kV, 22kV 또는 33kV, 2차 측에서 400V 또는 480V로 정격이 지정되는데, 이 전압 대역에서 공장 제작 패키지를 구성하는 것이 공장 내에서 직접 제작하는 것보다 경제적이기 때문입니다.
연구 출판물에 사용된 MVA 세분화는 전압 분할보다 실제 판매 품목을 더 정확하게 근사합니다. 시장을 적용 분야별로 세분화하는 것과 거의 일치합니다.
| MVA 범위 | 일반적인 적용 분야 | 명세를 결정하는 요인 |
|---|---|---|
| 10 MVA 미만 | 배전, 옥상 및 지상 설치 태양광, 상업 및 산업 시설 | kVA당 비용; 사용 가능한 설치 공간; 표준화된 인클로저. |
| 11~25 MVA | 유틸리티 규모 태양광 블록, 풍력 집전, 산업 플랜트 | 보호 체계; SCADA; 고조파 왜곡 제한. |
| 25~100 MVA | 그리드 연계, 대형 산업 및 데이터 센터 단지 | 고장 수준; 이중화; 계측; 규정 준수. |
| 100 MVA 이상 | 송전 수준, 일반적으로 E-House로 사용되지 않는 한 컨테이너형 아님 | 맞춤형 엔지니어링; 운송 제한; 현장 조립 등. |
MVA가 약 25 MVA를 초과하면 컨테이너는 더 이상 제품으로 간주되지 않고, 조립식 건물로 설계됩니다. 이 시점부터 MVA당 비용 추세가 평준화되기 시작하므로, 설계자는 이 범위를 넘어선 규모의 경제에 대한 가정을 할 때 이 제한 사항을 인지해야 합니다.
누가 이기고 있는가: 티어, 이름 및 지역 강점
경쟁 구도는 세 개의 티어로 나눌 수 있으나, 시장 점유율 샘플은 공개되지 않았습니다. 티어 1은 글로벌 전기 리더, 티어 2는 대형 지역 제조업체, 티어 3은 국가별 공장 및 전문 제조업체의 긴 목록을 포함합니다.
티어 1 — ABB, Siemens Alliance, Siemens Energy, Eaton, Schneider Electric 및 GE. 이들의 강점은 컨테이너 내부의 제품에 있으며, 보호 및 제어 시스템, 타입 테스트 문서, 그리고 이들의 장비를 기반으로 한 유틸리티 사양 작성이 사양에 대한 도전보다 덜 논쟁적입니다. Toshiba, Larsen & Toubro, Kirloskar, Crompton Greaves, IMESA, Elsewedy, Meidensha, Powell 및 Qingdao TGOOD과 같은 회사들은 모두 티어 2에 속하는 제조업체의 예입니다. 이들 티어 2 제조업체는 각자의 본국 지역뿐만 아니라 티어 2가 기준을 설정하는 다양한 시장 세그먼트에서 큰 존재감을 가지고 있습니다.
대부분의 프로젝트는 티어 3에서 완료됩니다. 이는 티어 3 시장의 약점이 아닙니다. 예를 들어, 동남아시아에 위치한 태양광 발전소용 2 MVA 배전 패키지는 글로벌 보호 플랫폼을 필요로 하지 않습니다. 준수하는 변압기, 타입 테스트된 링 메인 유닛, 변압기와 링 메인 유닛 모두를 포함하는 문서화된 루틴 테스트, 그리고 납품 일정이 필요합니다.
모니터링 계층의 요소들은 티어 3 경쟁의 기반을 형성합니다. 현재 신규 설치의 약 절반은 온도, 부분 방전 추세 및 차단기 상태 정보를 원격 모니터링하는 기능을 표준 기능으로 포함하고 있습니다; 이것이 intelligent integrated substation range 제공합니다. 패키지에 소액의 추가 비용이 들지만, 지능형 통합 변전소 기능은 서비스 계약 비용을 크게 증가시키며, 따라서 티어 3 공급업체들이 티어 1 경쟁업체보다 훨씬 빠른 속도로 이를 채택하고 있습니다. 또한, 두 가지 최근 제품 발표는 주요 제조업체들이 성장 추구 과정에서 상충하는 우선순위를 보여줍니다. 2023년 6월, Schneider는 그리드 외부의 재생 에너지 자원 통합을 목표로 하는 컨테이너형 마이크로그리드 솔루션을 출시했습니다. 2022년 10월, Siemens Energy는 신흥 시장, 특히 아프리카 진출을 위한 컨테이너형 변전소를 도입했습니다. 두 제조업체 모두 그리드와 각 회사 제품 제공 간 연결에서 병목 현상이 존재함을 인식했습니다.
시장 데이터가 구매자에게 알려주지 않는 것
The most important piece of information that a buyer needs to know before they look to purchase is the price per MVA, which is not provided in any of the summaries available to the public. The only information currently available to buyers is the pricing range of the different packages that include Transformer, MV Switchgear, LV Distribution, and Basic Protection Packages, which appear to average USD $80,000 – 200,000 for a 1 MVA and USD $500,000 – 1.2 million for a 10 MVA. The difference in prices within each category reflects the scope of work involved, as opposed to the profit margin for any individual company.
Another significant piece of information that is missing from the published data is the estimated lead time for equipment delivery. A 1 to 2.5 MVA standard distribution package will generally be available 12 – 20 weeks after placing a factory order with the manufacturer, primarily because the Transformer and Ring Main Unit are standard catalogue products. However, an End-User Utility specification with a custom protection scheme and factory witness testing and a defined short circuit study will take between 6 – 9 months to complete, primarily due to the need for Engineering Approval rather than the time involved in the manufacturing process.
The last important piece of data missing from the published market data is the site development cost associated with the equipment that the Buyer is attempting to replace with a containerised solution. The containerised solution will still require a foundation, cable trench, earth grid and connection agreement. Based on the Manufacturer’s claims, the site development costs and resulting speed of installation of a containerised solution are, in fact on average, 25 – 30% lower in comparison to building a brick structure, but this comparison is misleading. The comparison being made in the published data is to a fully functional transformer that is located on a foundation.
Where Subian Fits in This Market
Subian provides the majority of our volume when it comes to medium voltage distribution packages that range from several hundred kVA to approximately 10 MVA. Our packages can be supplied in both an enclosure-type box structure or as a containerized assembly, which includes the distribution transformer and all required MV and LV switchgear and LV distribution components pre-assembled and factory-tested prior to leaving the manufacturing facility. This accounts for approximately 54.7 percent of the overall market as discussed in this report, and it is where the factory with a dedicated transformer manufacturing facility has an advantage over integrators who do not have this capability and must purchase the transformers.
Subian’s offering in the distribution transformer and substations includes all standard configuration options: 11, 22 and 33 kV primary voltage, 400 to 480 volts secondary voltage, ONAN or ONAF cooling, and enclosure options available in painted steel, galvanized steel, or stainless, depending on where the equipment will be located. Subian’s employees configure the monitoring systems for each customer based on their specific requirements. Therefore, there is no “standard” for monitoring configurations, since it is likely that a mining customer who has no communication link will not wish to purchase telemetry that he/she cannot use.
Subian does not position itself to compete with the larger tier one providers; to do so would result in wasted resources for both sides. If a project specification requires any of the following: a global protection scheme, a specific type of relay, or a utility-type test certificate, the tier one providers will provide a superior product to Subian, therefore we would expend resources unnecessarily for both parties by quoting on this type of project. Conversely, when a project specification is performance-driven, the same type of performance rating is available at a different cost and lead time.
What to Watch Through 2030
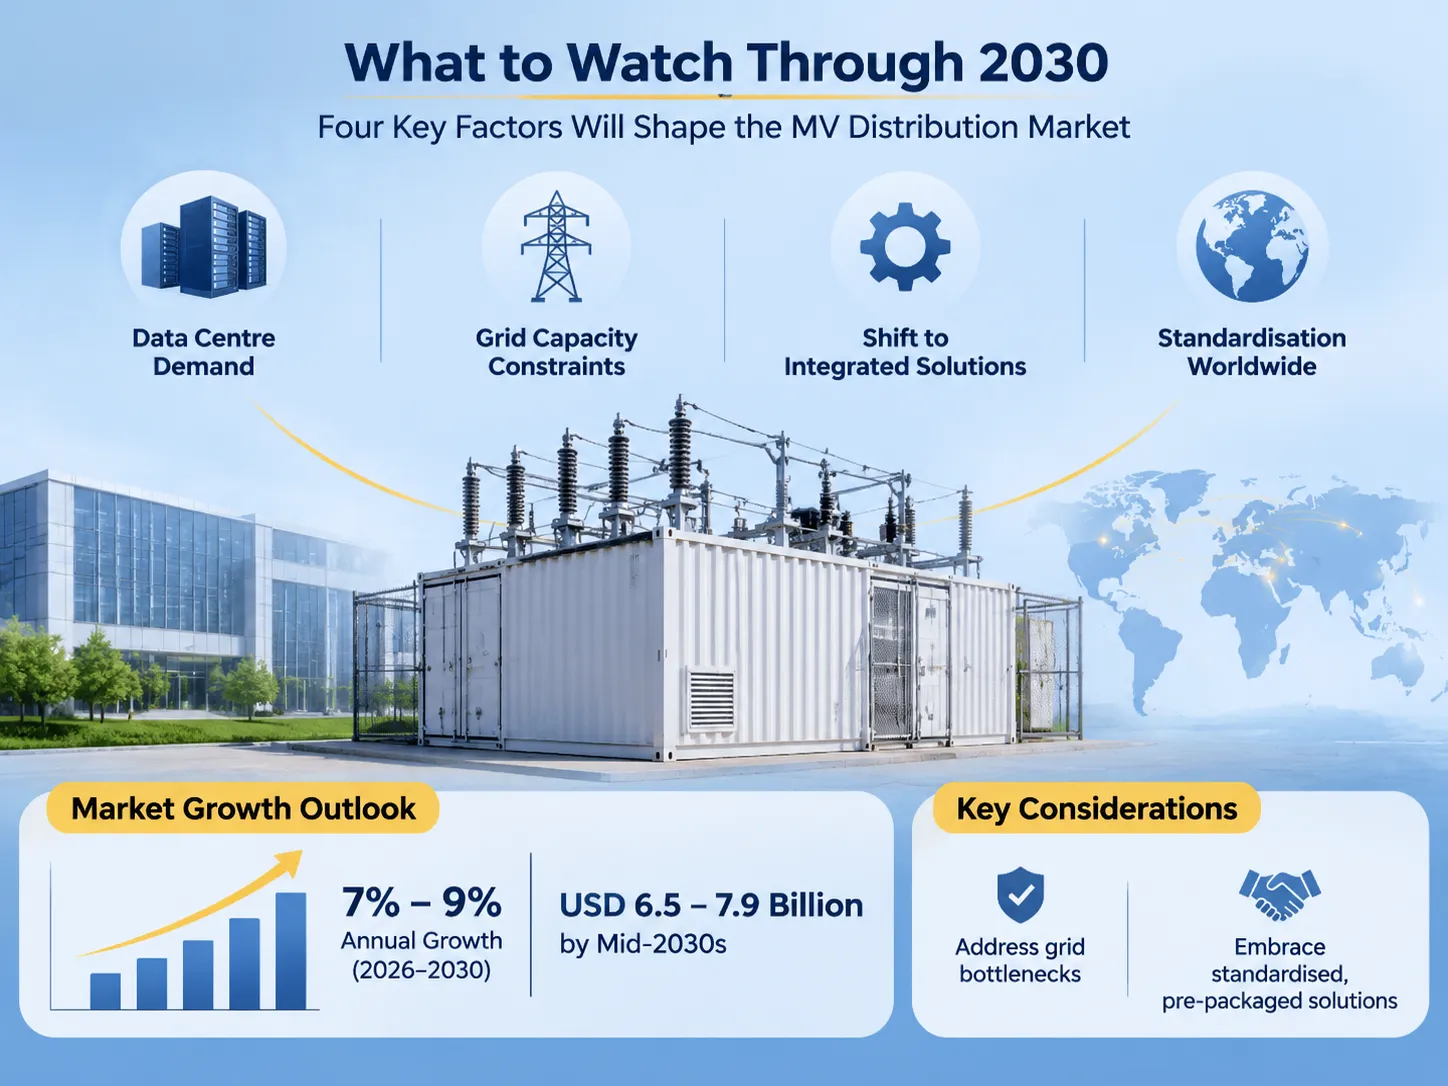
By 2030, the continued state of the medium voltage distribution market will be driven by the following four factors, with only three factors visible in the data to date:
The following areas are potential barriers to developing a sizable global containerized substation market:
- Daily growth of the data centre segment exceeds expectations according to most specialised publications. This suggests that the average size of a data centre will continue to increase, leading to a decrease in the number of smaller manufacturing facilities that supply to the sector. This is due to the fact that a typical 100 MW data centre buyer does not typically use a product catalogue for purchasing.
- There is insufficient capacity on the electrical grid to support large scale data centre development. A significant number of proposed data centres are currently experiencing construction delays due to the limited capacity of the grid. Therefore, product availability to shorten construction is not likely to have any effect on the length of time it takes to complete the necessary studies to obtain a construction permit. This situation will likely serve to limit the ability to grow in high-demand markets.
- There is a major transition from the sale of individual pieces of equipment to the sale of pre-packaged solutions. Recent reports indicate that approximately 50% of the data centre systems installed today are being monitored remotely. An even larger percentage (approximately 65%) of respondents to a recent survey indicated that they plan to increase their investment in remote monitoring solutions. As such, customers will be purchasing uptime and reporting, as opposed to buying the actual hardware.
- Countries are moving toward adopting standards. Each country has its own MV standard voltage. Each country also has its own MV design philosophy and each country has its own route of approval. A manufacturing operation that can offer three or four configurations in tooling will have a competitive advantage over an operation that is developing a new configuration for every order. The international comparison of substations provides examples of how these configurations vary throughout the world and represents the pragmatic continuation of this movement toward standardisation.
A market report released over the fall of 2026 predicted between USD 3.3 billion and USD 3.5 billion in revenue, a narrower definition placing it closer to USD 1.3 billion. In 2026, the annual growth forecast is expected to be between 7 per cent and 9 per cent with values at mid-2030s ranging from USD 6.5 billion to USD 7.9 billion depending on the scope.
자주 묻는 질문
Why are there contradictions among the size of the market in certain reports?
Market reports disagree with one another because they define the product differently: some are based on equipment revenue, whereas others include the delivered packaged product, including all protection, auxiliaries and testing. Some count large volumes of prefabricated buildings, whereas others count cargo crates and skids. The growth rate between market reports is more closely aligned than the total value.
Which region is experiencing the most growth?
China is experiencing the most rapid growth at approximately 11.5 per cent annually through 2036, followed by India at about 10.7 per cent. Both regions are ‘growing out’ rather than ‘replacing’ existing grids, which allows factory-built units to offer the fastest delivery times. While the United States is the slowest growing region among large markets and the growth is expected to be approximately 7.2 per cent, it is also a large market based on the financial value of its units being larger.
Are data centres currently driving the growth of the containerized substation market?
Currently, data centres are the fastest growing application for containerised substations; however, data centres are not yet the largest segment in the published tables. Published tables report renewable integration accounts for approximately 46 per cent of total sustained demand. The electricity consumed by data centre demand is found in the electricity statistics: a projected 415 TWh of electricity consumption in 2024 increasing to around 945 TWh in 2030, with approximately 45 per cent of consumption occurring within the United States.
What is the typical size substation that is packaged as a containerised substation?
The majority of packages will typically be less than 25 MVA and most packages will have a volume rating of less than 10 MVA. When packages exceed 25 MVA they become prefabricated buildings, and when they exceed 100 MVA they become E-Houses which are custom designed and assembled on site. The per MVA price will cease to fall at this transition.
What is the lead time to receive a containerised substation package?
Lead times for containerised substation packages will vary between twelve and twenty weeks for standard 1 to 2.5 MVA distribution packages, as the transformer and switchgear are catalogue products. Lead times for Utility Specification Containerised Substation packages will be six to nine months, and the reason for this delay is due to the need for customised protection and completion of engineering approvals versus actual production timelines.
참고 문헌
- Future Market Insights — Containerized Substation Market
- The Insight Partners — Containerized Substation Market
- Reanin — Containerized Substation Market
- IEA — Energy and AI
- Hitachi Energy — Grid and Substation Technology
결론
컨테이너형 변전소 시장은 30억 달러에서 40억 달러 규모로 예상되며, 예상 성장률은 7%에서 9% 사이입니다. 그러나 보고서 간의 차이는 유사한 데이터 소스를 기반으로 하면서도 동일한 시장에 대한 정의가 상충하기 때문입니다. 현재 컨테이너형 변전소 시장 내에서 가장 큰 매출 비중은 재생에너지 통합, 공익사업 및 중전압 시장에서 나올 것입니다. 데이터 센터 수요는 현재 예측에 변화를 초래할 것입니다.
For purchasers of containerised substations, it will be important to remember that the lead time for receipt is based on engineering approvals and not on factory capacity, and that the value of ratings under 10 MVA are the valued segments. In addition, that the specifications of a product, not its category, determines which two quotations can be compared against each other.