


The development report for the year 2024 of the China Electricity Council opens with a prediction that may not excite most people in the power industry: non-fossil sources are projected to represent 70% of installed capacity and close to 50% of produced electricity by the year 2030. For a buyer stationed in either Nairobi or Manila who is planning an upgrade of a substation, this statement is not some kind of abstract policy pronouncement – it represents an indicator of the transformer categories that will be available at factories two years from now, what price trends can be anticipated, and whether the equipment ordered now will be relevant in 2030.
This article breaks down the forecasts made by the CEC – the current situation in China, what the 2030 benchmarks actually signify in terms of installed capacity and produced energy, what kind of infrastructure needs to be developed to meet the objectives, and how the shift theoretically correlates with the demand for transformers, switchgear, and storage batteries of energy that should be accounted for by international buyers.
Short answer: According to the CEC, it is expected that the share of non-fossil installed capacity in China will grow from the current 53.9% to nearly 70% by 2030. The production of non-fossil energy shall approach 50% of total output. The electricity sector will represent 35% of total energy consumption, which is expected to exceed 13 trillion kWh. The growth will be conditioned by the ever-increasing use of renewable energy sources.
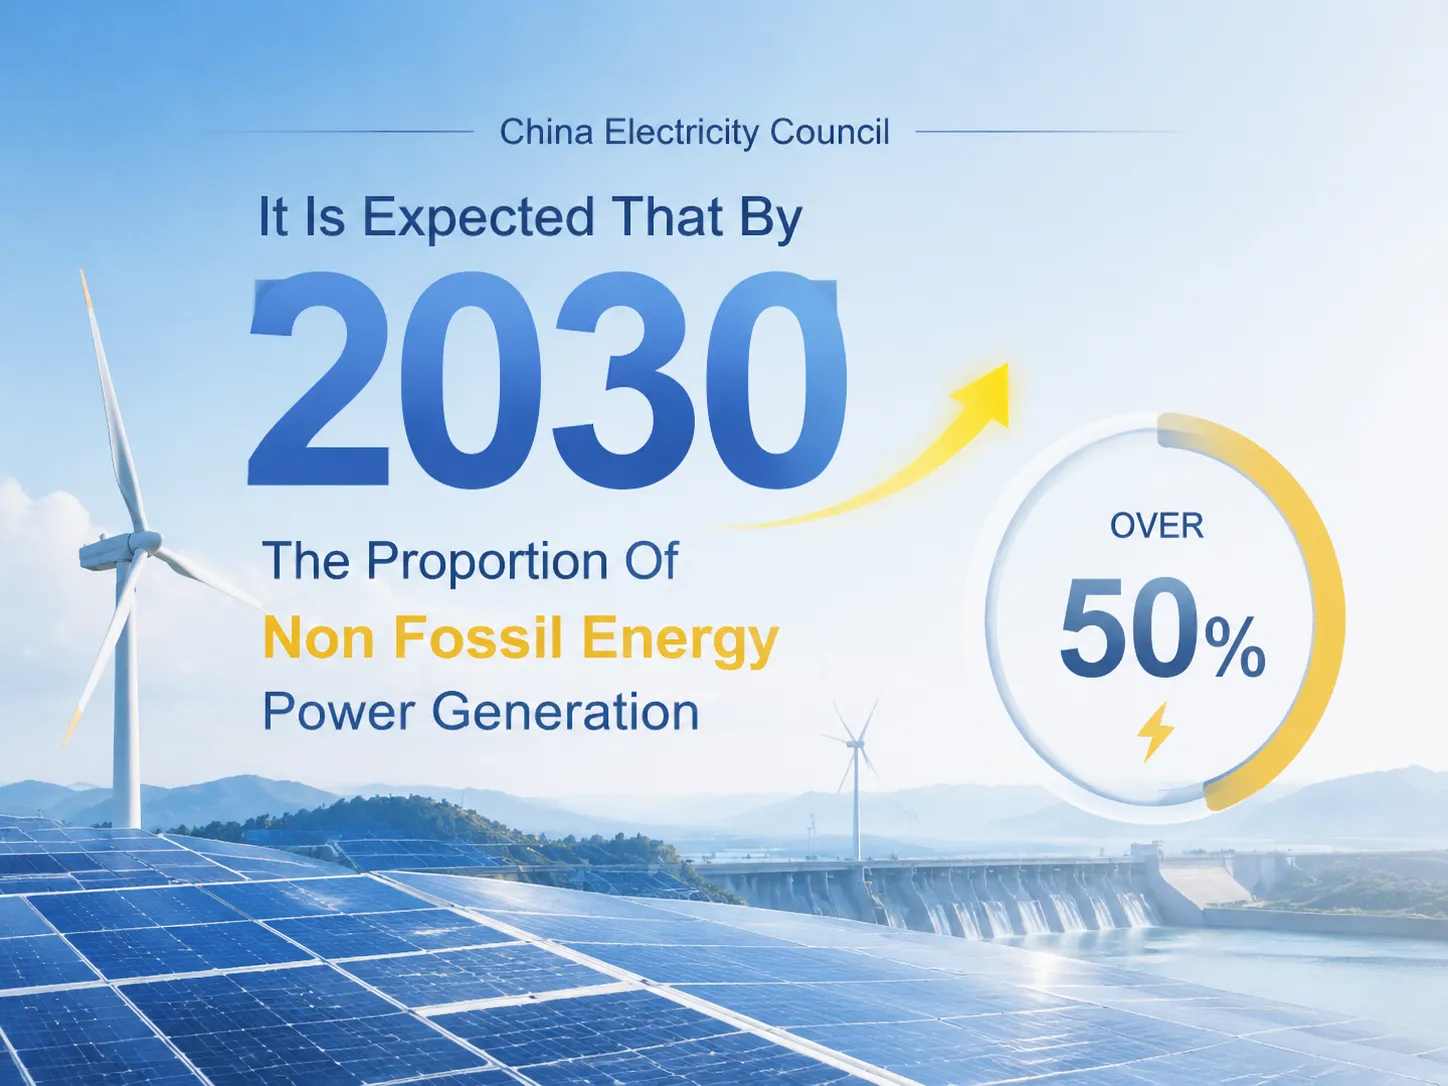
Table of Contents
- What the CEC Is Forecasting
- Where China Stands Today
- The 2030 Forecasts in Detail
- Installed Share vs. Generation Share: Why Both Matter
- What It Takes to Get There: Grid, Storage, Flexibility
- The Equipment Demand the Transition Creates
- What This Means for Global Buyers
- Manufacturers Positioned for the Shift
- Frequently Asked Questions
- References
- Conclusion
What the CEC Is Forecasting
The China Electric Power Industry Annual Development Report 2024 released by CEC indicates that by the year 2030, non-fossil installed generating capacity will reach around 70%, which will lead to a non-fossil energy share of approximately 25% in primary energy consumption and roughly 35% in electricity consumption of final energy consumption. Total electricity consumption is expected to reach over 13,000 billion kWh in 2030, compared to the figure of 9,220 billion kWh in the year 2023. The rise in electricity consumption is explicitly linked to the achievement of national carbon peak goals and large-scale wind-solar energy generation projects coupled with pumped storage systems and battery storage facilities.
This is not an insignificant forecast. The increase in the non-fossil energy share from 53.9% (2023) to roughly 70% (2030) calls for about 2 billion kW of capacity increase over seven years while the total amount of energy-generating equipment goes from 2.92 million kW to around 5.4 million kW in that timeframe. For the country that builds most of the energy-generating equipment worldwide, this development carries serious implications for the global energy-producing equipment industry.
Where China Stands Today
The credibility of the projection can be traced back to its 2023 base year. By the end of 2023, China had 2,922 GW installed capacity from which 1,576 GW, or 53.9%, was non-fossil. The coal share in total capacity fell under 40% for the first time. Total generation in China was 9,456 TWh, with the wind energy provided 886 TWh and solar energy 584 TWh.
| Metric (end-2023) | Value | Change vs. 2022 |
|---|---|---|
| Total installed capacity | 2,922 GW | +14.0% |
| Non-fossil installed capacity | 1,576 GW | +24.1% |
| Non-fossil share of installed | 53.9% | First time above 50% |
| Coal share of installed | 39.9% | First time below 40% |
| Total generation | 9,456 TWh | +6.9% |
| Wind generation | 886 TWh | +16.2% |
| Solar generation | 584 TWh | +36.7% |
The path leading to the year 2024 supports the trend: by the end of the year, the installed capacities of wind and solar power were around 510 GW and 840 GW, respectively, with the share of non-fossil powers in total installed capacity being about 57-58%. The target of 70% renewal of the generation capacity by 2030 is ambitious but corresponds to the previous data.
The 2030 Forecasts in Detail
Across its reports and the renewable plan it supports, the CEC has published a consistent set of 2030 numbers:
| 2030 Indicator | Forecast | 2023 Actual (Comparison) |
|---|---|---|
| Non-fossil share of installed capacity | ~70% | 53.9% |
| Non-fossil share of electricity output | ~50% | ~33% |
| Electricity share of final energy consumption | ~35% | ~28% |
| Total electricity consumption | 13+ trillion kWh | 9.22 trillion kWh |
| Total installed capacity | ~5.4 TW | 2.92 TW |
| Wind + solar installed | 2.8 TW+ | 1.05 TW |
| Renewable generation | ~6 trillion kWh | 2.95 trillion kWh |
In any internal memo on planning, it is vital to highlight three numbers. The first is that the sum of wind and solar power must increase from 1.05 TW to 2.8 TW, an increase of about 3 times. The second is that the share of non-fossil production must rise from one third to one half. This is the more complicated share for non-fossil generation depends not just on capacity, but also on other factors, including usage. The third significant number is that electricity demand will rise by about 40%. This means that the entire distribution system and every transformer in the system will also have to grow rapidly.
Installed Share vs. Generation Share: Why Both Matter
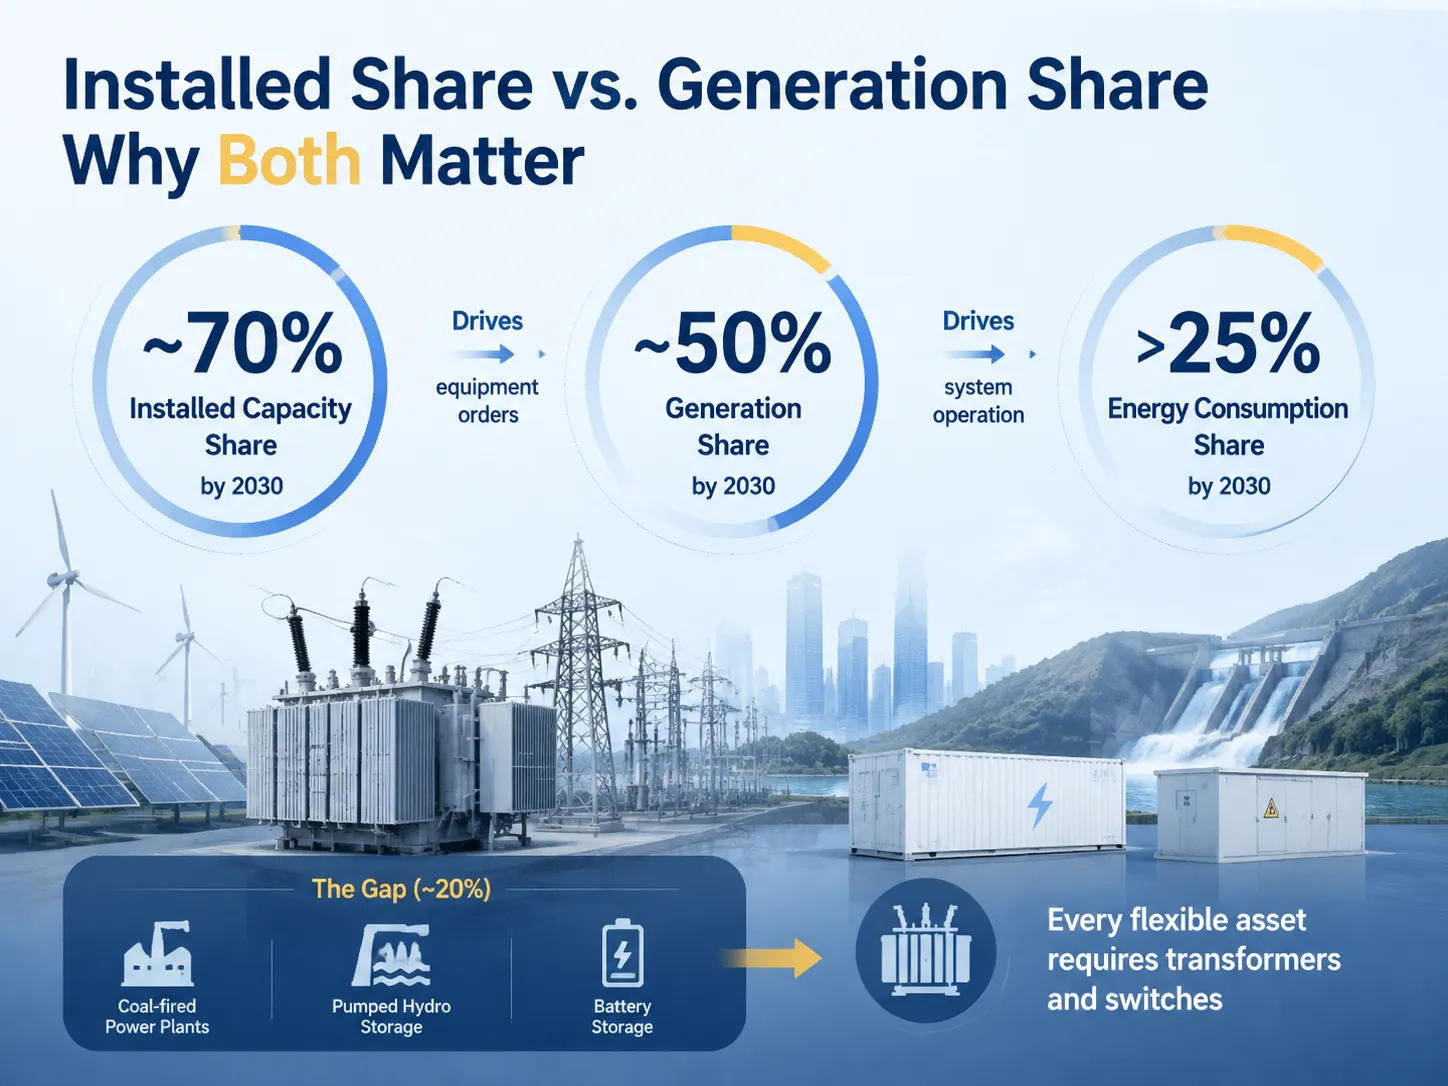
Customers often mistake between the two shares since the difference changes the buying perspective. Having the installed share (which is expected to be 70% by 2030) drives the amount of transformers and inverters installed and connected to the system – it is an equipment-ordering number. The generation share (~50% by 2030) drives consumption, curtailment, and system operation – it is a performance number.
| Share | 2030 Target | What It Drives | Example Implication |
|---|---|---|---|
| Installed capacity share | ~70% non-fossil | New plant + connection equipment orders | Millions of step-up transformers needed |
| Generation share | ~50% non-fossil | Dispatch, storage, flexibility investment | Storage + OLTC-heavy transformers demanded |
| Energy consumption share | >25% non-fossil | Electrification of industry, transport | Distribution upgrades in cities and factories |
Coal-fired power plants, pumped hydroelectric storage plants, and batteries used for surplus solar energy storage make up the difference between the installed capacity share (70%) and the electricity generation share (50%). Each flexible asset requires transformers and switches for its operations.
What It Takes to Get There: Grid, Storage, Flexibility
In order to reach a 50% share in generation capacity without jeopardizing the stability of the grid, the use of flexible assets is of critical importance, and thankfully, China is on the right track in terms of acquiring those in bulk:
- Pumped storage plants: the installed capacity reached 51 GW in 2023, and it is projected to double by 2030. Each plant requires its own set of transformers.
- Battery storage: the rate of installations of grid-level and distributed energy storage systems has reached around 50 GW a year. Each Energy Storage System also requires transformers rated for bidirectional operation.
- UHV infrastructure: State Grid operates a total of 19 AC and 16 DC UHV lines. More are planned to transmit wind and solar energy produced in the northwest to the coastal regions.
- This is a leading consumer of large power transformers on the planet.
- Reinforcement of the distribution system: the majority of grid investments go into 110 kV network and below. Distribution transformers are now the leading category of transformers due to this transition.
- Demand-side response: the development of electrified industries and the growth of EV charging (which is expected to increase by 78.1% in 2023) will add to the total costs, requiring smarter LV equipment and metering technologies.
For manufacturers, the reality is simple: the roadmap to 2030 is based on an entirely new class of goods – heavy-duty transformers for transmission lines, as well as distribution and LV technology for the construction of the distribution system. The two markets are fully loaded for production during the nearest planning phase.
The Equipment Demand the Transition Creates
The numbers reveal an approximate scale of demand. Assuming the non-fossil installed capacity increases by about 2 TW from 2023 to 2030, and that 1 to 2 MW of wind or solar energy requires one transformer, this transition will mean an order of magnitude of 1 to 1.5 million high-voltage transformers and other equipment over 7 years, which does not even include the reinforcement and storage technologies. Even if the increase in size of turbines and inverters is taken into account, the figure will still remain in six digits each year.
| Equipment Class | 2030 Demand Driver | Indicative Price (FOB China) |
|---|---|---|
| Distribution transformers (100-1,000 kVA) | Feeder-level renewable + electrification | $2,500-$20,000 |
| Renewable step-up (1,500-2,500 kVA) | Utility PV, small wind collection | $20,000-$45,000 |
| Medium power (10-40 MVA) | Wind farm collection, industrial | $80,000-$250,000 |
| Large power (40-500 MVA) | UHV corridors, pumped storage | $500,000-$4,000,000 |
| LV/MV switchgear | Substations, storage containers | $2,000-$60,000 per board |
Costs depend on different countries, specifications, and brands. Though costs are different, what is actually important here is direction: every entry in the table is subject to supply pressure. Today, delivery times for normal distribution transformers range between 8 and 16 weeks, while those for large power transformers can amount to between 6 and 12 months.
What This Means for Global Buyers
In case of international procurement, the CEC’s forecast can preferably be regarded as the one related to availability of capacity of the transformer industry in the world whose leader is located in China:
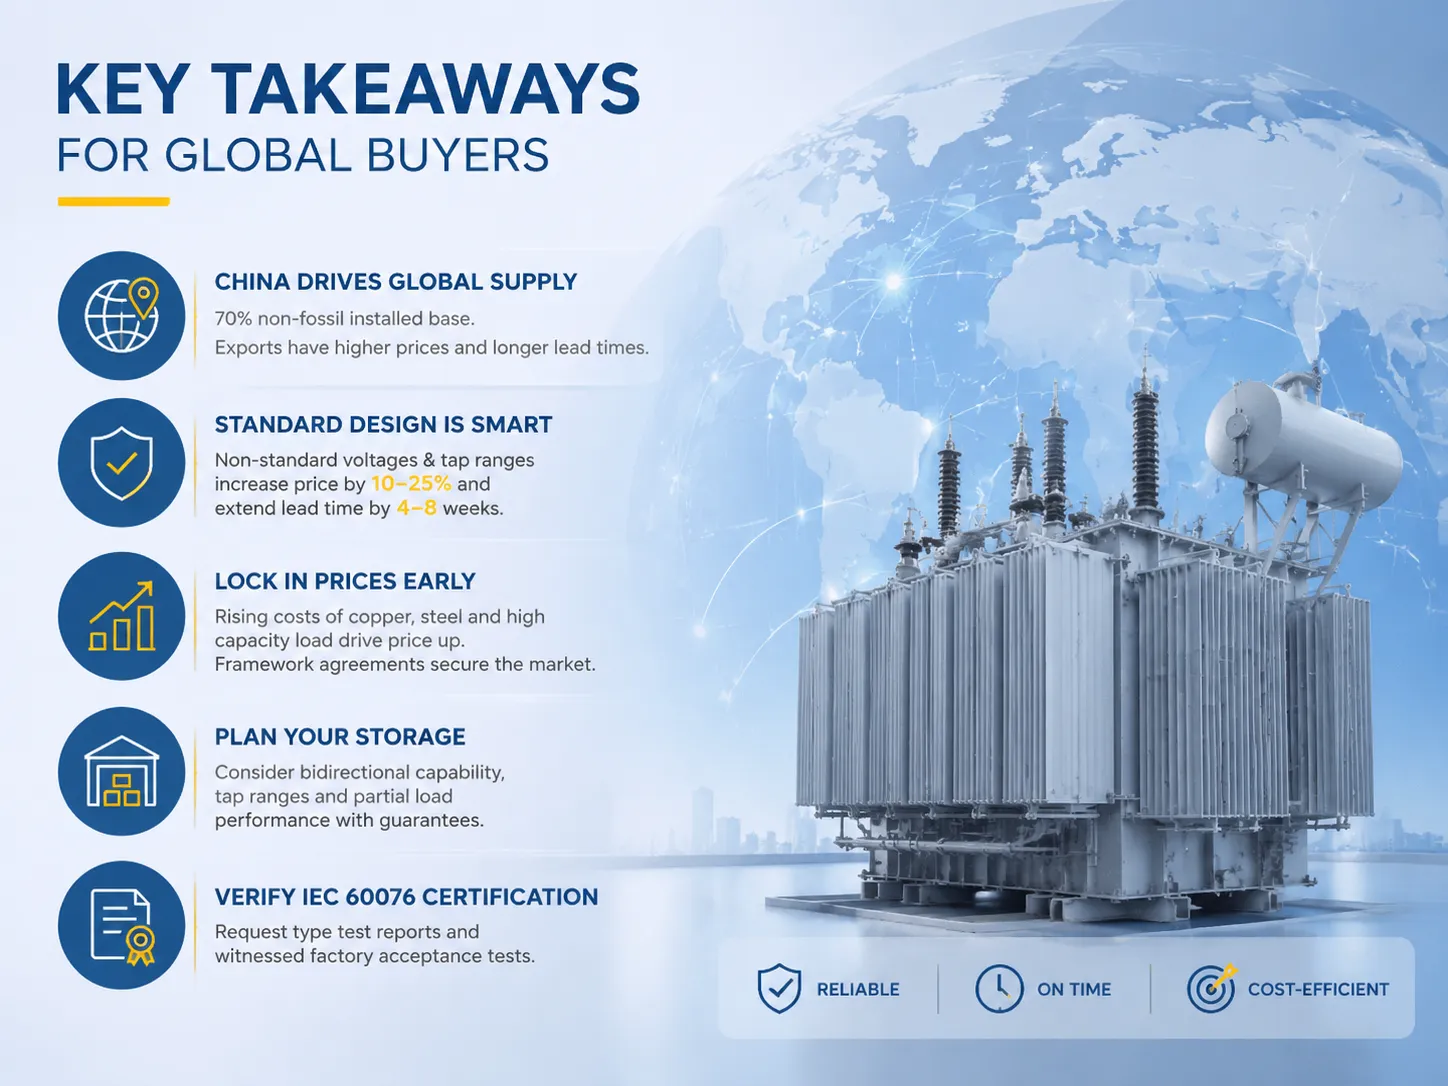
- The limitation of supply in the world markets is determined by the state of China. Since the non-fossil installed base is only 70%, Chinese plants work first of all for their domestic markets; the orders for export have higher price and are placed for a large period forward.
- Standard design is the reasonable decision. Non-standard voltages and individual tap ranges lead to price increase by 10-25% and to waiting periods prolongation by 4-8 weeks.
- Use standard design wherever it is possible in your country.
- Lock the price at the early stages. The prices for copper and grain-oriented steel, as well as the high load of the production facilities increase the general cost trends for the transformers; framework agreements allow to secure the market.
- Plan the storage needs. If your project presupposes storage, purchase transformers capable to work in both direction and equipped with tap ranges as well as with guarantees of the partial loads.
- Check for presence of IEC 60076 certificate. As demand increases, unreliable brokers appear; you need to request both type test reports and witnessed factory acceptance tests.
Manufacturers Positioned for the Shift
The organizations that are best set for a non-fossil fuel world with about 70 percent of energy produced from renewable sources are those that are well entrenched in renewable energy and the grid industry. Hitachi Energy and Siemens Energy lead the design and production of large power transformers and HVDC technology, ABB is involved in low and medium voltage devices and grid automation technology, and Schneider Electric is involved in digital distribution and switchgear technology. In China, TBEA, Baoding Tianwei, and China XD Group generate the volume for domestic transmission and export markets, while local companies provide distribution solutions.
| Manufacturer | Positioning | Renewable/Grid Products |
|---|---|---|
| Hitachi Energy | Premium | HVDC, 500 kV+ transformers |
| Siemens Energy | Premium | Power transformers, grid solutions |
| ABB | Premium | Distribution step-ups, LV/MV switchgear |
| Schneider Electric | Mid-premium | Digital switchgear, LV distribution |
| TBEA / Baoding Tianwei / XD Group | Volume | Distribution to 1,000 kV class |
| Jiangsu Subian Electric Power | Competitive | IEC 60076-certified distribution and medium power transformers |
Amid the premium international tier and the domestic volume leaders lies an aggressive segment of IEC-certified Chinese manufacturers that cater to export projects directly. Jiangsu Subian Electric Power is representative of that segment: IEC 60076-certified, manufacturing oil-immersed and dry-type distribution transformers and medium power units for renewable, industrial, and utility customers in Asia, Africa, the Middle East, and Latin America, with realistic lead times of 8-16 weeks for standard designs. In a supply-constrained market, that combination of certification and scheduling commitment is what the purchaser is searching for.
Frequently Asked Questions
What exactly is the CEC’s 2030 non-fossil forecast?
The China Electricity Council’s Annual Development Report 2024 indicates that by 2030, about 70 percent of China’s installed capacity will be made of non-fossil sources, and non-fossil generation will make nearly 50 percent of the total electricity output, and electricity will account for approximately 35 percent of the final energy balance. Total electricity use is expected to reach over 13 trillion kWh, compared to 9.22 trillion kWh in 2023.
What is China’s non-fossil share today?
Non-fossil resources made up 53.9% of installed capacity in 2023 – marking the first year over 50% – with generation constituting about one-third of the total output. The amount of wind energy generated by late 2024 was about 510 GW, while solar was at about 840 GW, further increasing the non-fossil share to about 57-58%.
How many transformers will the 2030 transition need?
The requirement of adding 2 TW of renewable capacity means there would be a need for roughly 1 million – 1.5 million transformers between 2023 and 2030, which does not cover the reinforcements required for the grid and storage facilities. Generally, distribution transformers are produced in greater volumes, while large power transformers for high-voltage corridors are the bottleneck.
What does the non-fossil target mean for transformer prices?
Constant demand means strong pricing. A 100 kVA distribution transformer has a price range of $2,500 to $5,000 including freight transport from China whereas the cost of the 1,000 kVA model is between $9,000 and $20,000. A renewable step-up transformer of the 2,000 kVA type costs between $20,000 and $45,000. Standard designs usually take between 8 and 16 weeks to manufacture; and large power transformers typically take between 6 and 12 months.
Should I buy different transformers because of the energy transition?
If your project is about investing in renewable or storage assets, then, yes, you should consider suitable OLTC tap range specifications, guarantees regarding partial load (20-40%) circuit losses, upgraded short-circuit withstand and some consideration of inverter harmonics. If you order ordinary distribution capacity, transition affects only the cost and lead time, no the type of solution.
References
- China Electricity Council (CEC) – Publisher of the China Electric Power Industry Annual Development Report 2024 and the 2030 non-fossil share forecasts cited in this article.
- National Energy Administration (NEA) – Regulator source for the renewable plan targets and monthly installed capacity statistics.
- IEA Electricity 2024 – Independent forecast of global electricity demand and supply relevant to the China transition outlook.
- IEA: China country profile – International context on China’s carbon targets and grid integration needs.
- IEC 60076-1: Power transformers – General – The type-testing standard for transformers serving the renewable and grid buildout.
- IEC 61439: Low-voltage switchgear and controlgear assemblies – Assembly standard for the switchgear accompanying new renewable connections.
- Jiangsu Subian Electric Power – IEC 60076-certified Chinese transformer manufacturer supplying the distribution and medium power segment of the transition.
Conclusion
The CEC forecasts that non-fossil sources will provide us with about 70 percent of the installed capacity and roughly half of the generation in the year 2030. It implies millions of transformers and switchgear assemblies in the coming period, which maintains prices firm and causes delays with the supply of equipment from constrained sectors of power equipment production.
The procurement strategy is easy to follow: standardize specifications, sign the frame contracts early, check IEC 60076 certification compliance, and procure storage-capable specifications where the project involves batteries or renewable sources of energy with a high penetration ratio. A good partner for customers is Jiangsu Subian Electric Power, which manufactures certified power transformers and medium transformers with realistic lead time limits.