


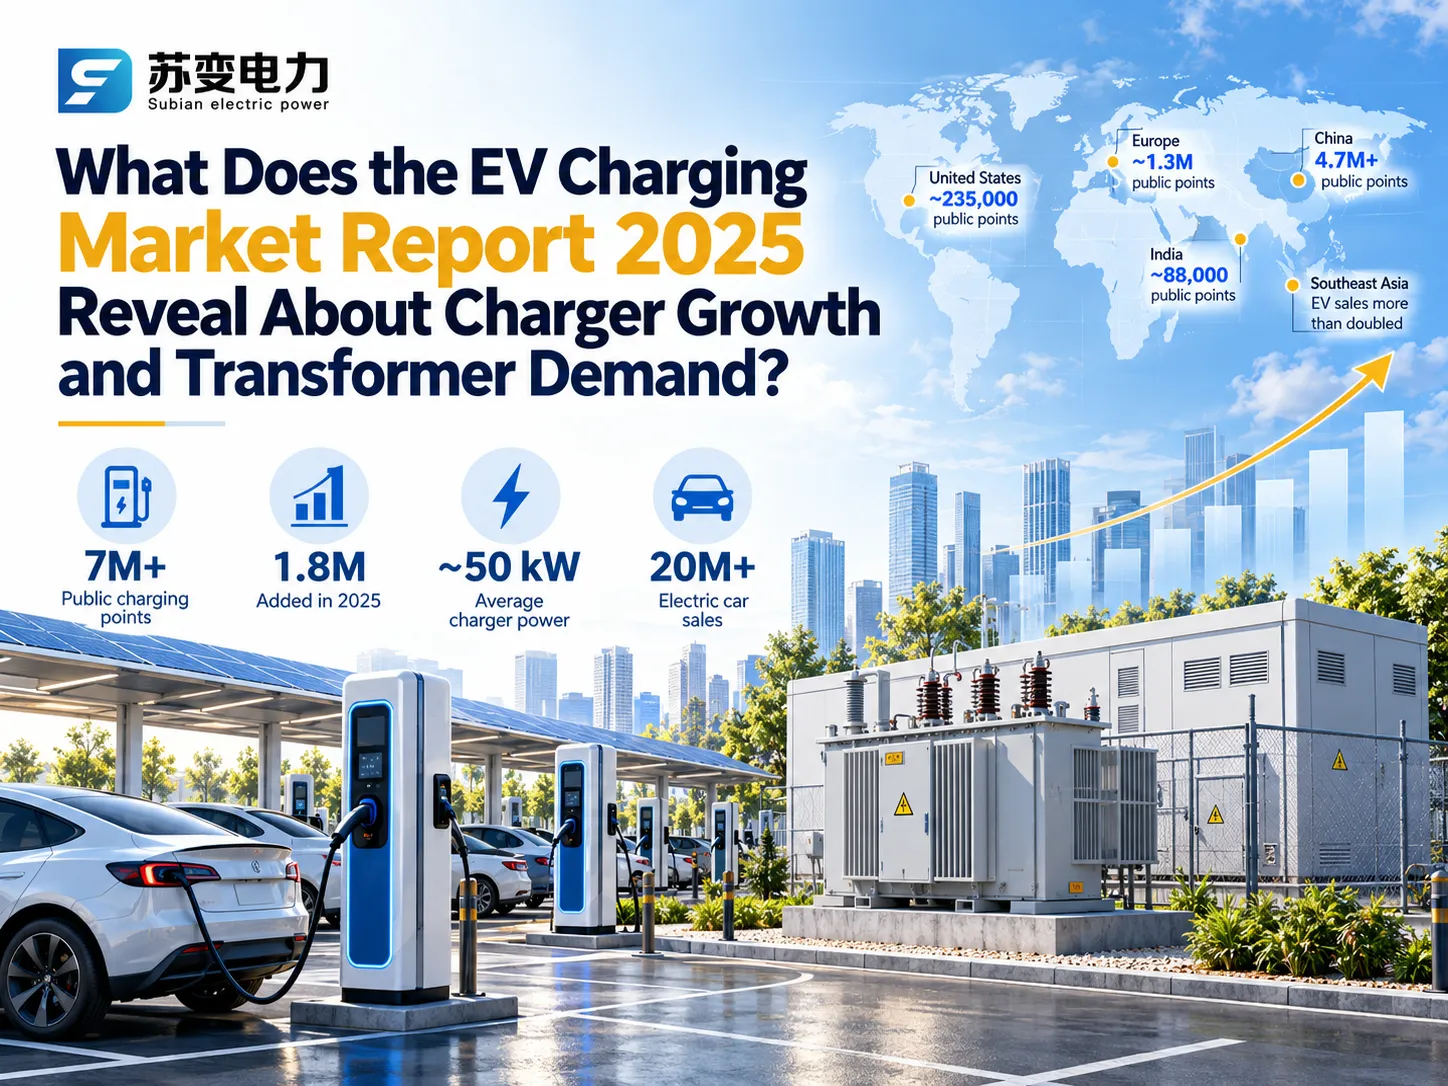
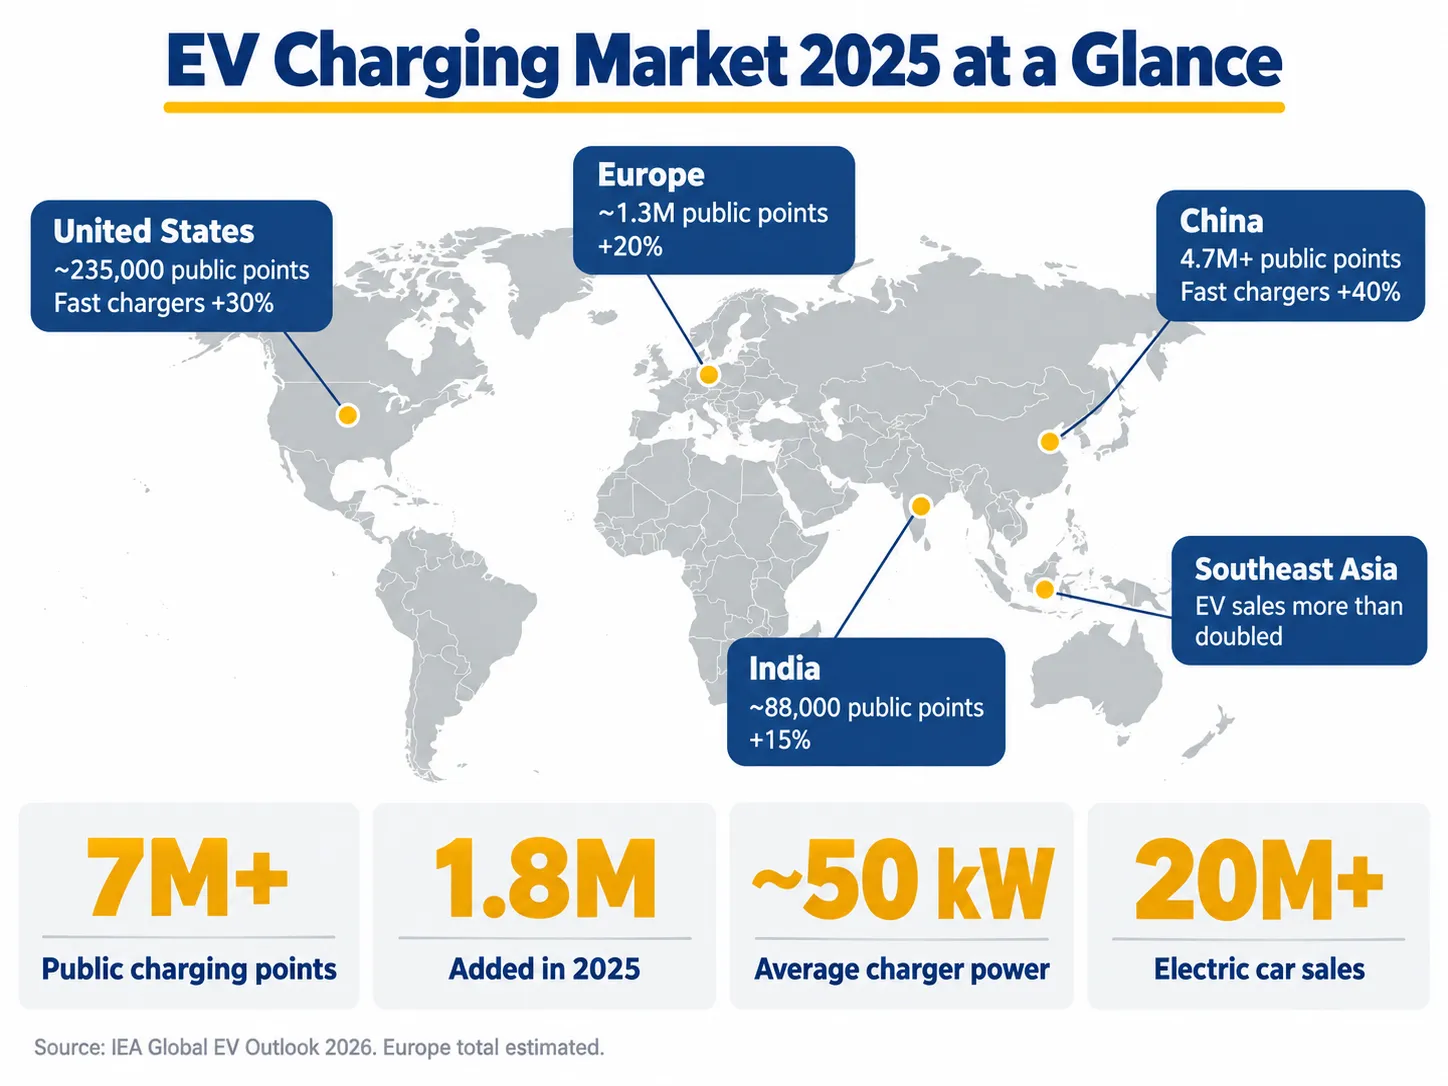
En la versión corta: 2025 fue igualmente impresionante en términos de carga de vehículos eléctricos. Un artículo de la Agencia Internacional de Energía informa que al final del año el mundo tiene más de 7 millones de estaciones de carga públicas después de instalar casi 1.8 millones este año, lo que representa un aumento de más del 33 por ciento. El 65 por ciento de todo el equipo está instalado en China, el nivel promedio del cargador público ha aumentado a aproximadamente 50 kW y la instalación de cargadores rápidos y ultrarrápidos es mucho mayor que la de los lentos. Las ventas de vehículos eléctricos ascendieron a más de 20 millones, lo que significa que uno de cada cuatro coches vendidos en todo el mundo es un vehículo eléctrico.
Todos esos cargadores necesitan algún equipo eléctrico: transformador, equipos de conmutación y la conexión a la red local. Este informe resume la información principal del informe de carga de vehículos eléctricos 2025 y proporciona comparaciones entre las principales áreas del mundo, muestra la tendencia de la instalación de cargadores más rápidos y aclara las consecuencias de tal crecimiento en transformadores y subestaciones. Es el segundo artículo de nuestra serie de carga de vehículos eléctricos; el primero explica lo que dice el estudio del DOE sobre las actualizaciones de transformadores de distribución y alimentadores.
¿Qué informe cubre realmente el mercado de carga de vehículos eléctricos 2025?
Una fuente de malentendidos es el año del informe. El Panorama Global de Vehículos Eléctricos se publica cada primavera por la IEA. Por lo tanto, la última edición del informe, que aún está en progreso, es la edición 2025. De esta manera, cualquier edición del informe proporciona información sobre el año anterior.
| Informe | Publicado | Año de mercado que revisa | Cifra principal de carga |
|---|---|---|---|
| Panorama Global de Vehículos Eléctricos 2025 | Primavera 2025 | 2024 | Más de 5 millones de puntos de carga públicos, más de 1.3 millones añadidos en 2024 |
| Panorama Global de Vehículos Eléctricos 2026 | Primavera 2026 | 2025 | Más de 7 millones de puntos de carga públicos, casi 1.8 millones añadidos en 2025 |
En esencia, si quieres averiguar qué ocurrió realmente en el área de carga de vehículos eléctricos en 2025, tienes que leer la edición 2026 del informe. De lo contrario, las estadísticas en este artículo se han derivado de esta última edición a menos que se especifique lo contrario.
El Mercado Global de Carga de Vehículos Eléctricos en 2025: Números Clave
| Indicador | Final de 2025 | Cambio respecto a 2024 |
|---|---|---|
| Puntos de carga públicos en todo el mundo | Más de 7 millones | Aumento de más del 33 por ciento, casi 1.8 millones añadidos |
| Puntos de carga privados para vehículos eléctricos ligeros | Más de 43 millones | Sirviendo a aproximadamente 76 millones de vehículos eléctricos ligeros |
| Vehículos eléctricos por punto de carga público | Aproximadamente 11 | Similar a 2024 |
| Potencia promedio del cargador público | Casi 50 kW | Aumento del 15 por ciento desde poco más de 40 kW |
| Capacidad de carga pública por vehículo eléctrico | 5 kW | Aumento desde 4 kW |
| Ventas de coches eléctricos | Más de 20 millones | Aumento de aproximadamente el 20 por ciento, alrededor de uno de cada cuatro coches nuevos |
| Participación de ventas de camiones eléctricos | 9 por ciento de las ventas globales de camiones | Más que se ha duplicado |
Al planificar la infraestructura eléctrica, dos de estos números son especialmente importantes. Tanto la relación entre el número de vehículos y el número de cargadores, que no cambió mucho en absoluto, como el hecho de que el cargador promedio puede cargar más rápido que antes, muestran que el despliegue de cargadores estaba en equilibrio con las ventas de vehículos en lugar de quedarse atrás. No solo las redes de carga aumentan en cantidad, sino que también se vuelven más sustanciales en términos de potencia.
El comportamiento de carga demuestra la existencia del resto del panorama también. Se ha informado que los propietarios de vehículos eléctricos a nivel mundial cargan sus vehículos de manera privada durante aproximadamente el 75% de su tiempo de carga y visitan estaciones de carga rápida públicas solo alrededor del 10% de este tiempo.
Cómo difiere el mercado de carga de vehículos eléctricos por región
| Región | Puntos de carga públicos, 2025 | Crecimiento y tendencia clave | Vehículos eléctricos por punto público |
|---|---|---|---|
| China | More than 4.7 million | About 1.3 million added; fast and ultra-fast points up 40 percent to 2.2 million | 10 |
| Europa | About 1.3 million | Up about 20 percent, about 260,000 added; EU ultra-fast points up 30 percent | 11 in the EU |
| Estados Unidos | About 235,000 | Record additions; fast and ultra-fast points up 30 percent to nearly 70,000 | 33 |
| India | About 88,000 | Up 15 percent; national program targeting 22,100 fast chargers | Not stated |
| Corea | Fast and ultra-fast: about 51,000 | Fast points up 10 percent; capacity above 9 kW per EV | Just over 2 |
The European total is our approximation, based on just over 1 million points at the end of 2024 plus about 260,000 added in 2025.
China: Increase and Speed
In 2025, China added more public chargers than any other country altogether, totaling more than 75% of growth globally. In addition, the average public charger in the country is rated above 55 kW, while public capacity is almost 6 kW for every electric vehicle. This is determined to a large extent by residential clients. Only a half of Chinese electric vehicle owners possess a home charger while a few other clients have access to shared residential chargers. Therefore, the role of public fast charging becomes more significant compared to those markets with more separate houses.
Europe: Development and Ultra-Fast Corridors
The growth of public charging in Europe was more stable, about 20%. The Netherlands was the first, with around 210,000 public points, followed by Germany with 196,000, and then France with 185,000, while the UK managed to exceed 116,000, with a growth of more than 30%. The main trend is seen on highways; according to EU rules in accordance with the Alternative Fuels Infrastructure Regulation, there should be fast-charging pools at relatively small intervals along the main transportation corridors. In addition, ultra-fast points in the EU grew by 30% in 2025. Furthermore, public capacity in Europe still has a tendency to develop.
United States: Fast Charging Leadership and Coverage Lagging
The USA had a stellar year concerning public chargers, with over 20% added when compared to previous year, while fast and ultra-fast development went up to almost 70,000 points. Yet, this country has about only 3% of public chargers globally with about 10% of EVs. It means that there are 33 vehicles for one public charger, while in 2020 this rate was below 20. Most customers in the USA charge at home, which shows that there is still a certain potential for investments in public charging along highways and in case of fleets.
Emerging Markets: Fastest-Growing Country
The highest rate of growth was seen in the countries with minor results several years ago. In particular, EV sales doubled in Southeast Asia and grew by around 75% in Latin America by 2025. Thailand possesses almost 12,000 public chargers, over 60% of which are fast; in Malaysia, public fast chargers grew by more than 70%; the public utility of Indonesia installed more than 4,500 public chargers; and Brazil managed to grow the number of public chargers by around 35%. In several of the indicated countries, the growth of chargers is being lagged behind the growth of EVs.
DC Fast Charging Trends: Faster Chargers, Higher Voltage
One of the most notable technological trends in the market is the transition to greater power levels. The mean public charger has jumped from little over forty kilowatts to almost fifty kilowatts just in a single year, and DC fast charging outlets are growing faster than all slow charging outlets in all significant areas.
Vehicles have been catching up with the charging stations. Approximately one hundred sixty varieties of battery powered electric vehicles will be able to charge more than one hundred fifty kilowatts by the year twenty twenty-five, while the first one thousand volt models for vehicles were also made available during this time. In early twenty twenty-six, BYD released megachargers with thirty-MW capacity. The International Energy Association warns, on the other hand, that less than thirty percent of electric cars can utilize super-fast charging and less than five percent of the cars can be capable of charging above two hundred fifty kilowatts. Thus, ultrafast charging sites should be constructed not for existing vehicles only, but for the future of the vehicles.
In the case of electricity grid, increased power of charging stations modifies the scale of each site. A highway point with eight dispensers of three hundred fifty kW power will also have a power rating of twenty-eight hundred kW, which is similar to the power load of a small factory; as a rule, it needs a separate connection to the medium voltage power grid and its own transformer and often also a pre-assembled substation.
Heavy-Duty and Depot Charging: The Next Big Load
Electric trucks and buses are shifting charging from kilowatts to megawatts. In 2025, electric truck sales grew more than twofold to 9% of global sales, while approximately one in four trucks sold in China was electric.
There are over 500,000 electric heavy-duty trucks globally and more than 70,000 available charging stations.
China has almost 1 million electric trucks at work. Most truck charging stations operate at 300-400 kW rates, while only around 1% can exceed 1,000 kW.
The EU has over 4,000 charging stations for trucks; nearly all electric trucks are charged at higher than 150 kW rates. There are 40 stations in the EU operating at 1,000+ kW rates.
Germany has approved EUR 1.6 billion for 350 planned charging stations.
In 2025, the U.S. has installed about 400 charging stations for medium and heavy-duty vehicles and is working on nearly 1,000 more stations.
Urban depots are where the bottleneck lies, as the IEA reports that delays in connection to the electricity grid are among the biggest barriers for electrifying bus transport. Limited capacity of substations, permitting delays, and grid reinforcement can mean years-long delays for deploying urban depots, according to the IEA report.
What 7 Million Chargers Mean for the Grid
Multiplying the statistics of the IEA gives an idea of the importance of the charged current. With the number of public points exceeding 7 million and an average of almost 50 kW, or 4.5 kW of public capacity for each of approximately 76 million electric vehicles, the current public charging network has around 340-350 GW of total capacity. This is our own assessment, not the official numbers of the IEA. However, every kilowatt of that capacity needs to be supplied via distribution transformers, switching equipment, and wiring. Most of the additional capacity was provided over the last three years.
When looking ahead, the IEA expects the electricity demand for EVs to surpass 1,500 TWh at the time of 2035, which makes it six times more compared to 2025. Adding 1,500 TWh will have different influences all over the world as globally it will mean only about a 4% rise in electricity consumption. However, in Europe total electricity consumption will rise by over 10% and in China by less than 6%. Our guide to the DOE EV charging grid study explains how planners decide whether a service transformer, feeder or substation needs reinforcement.
Where EV Charging Growth Creates Transformer and Substation Demand
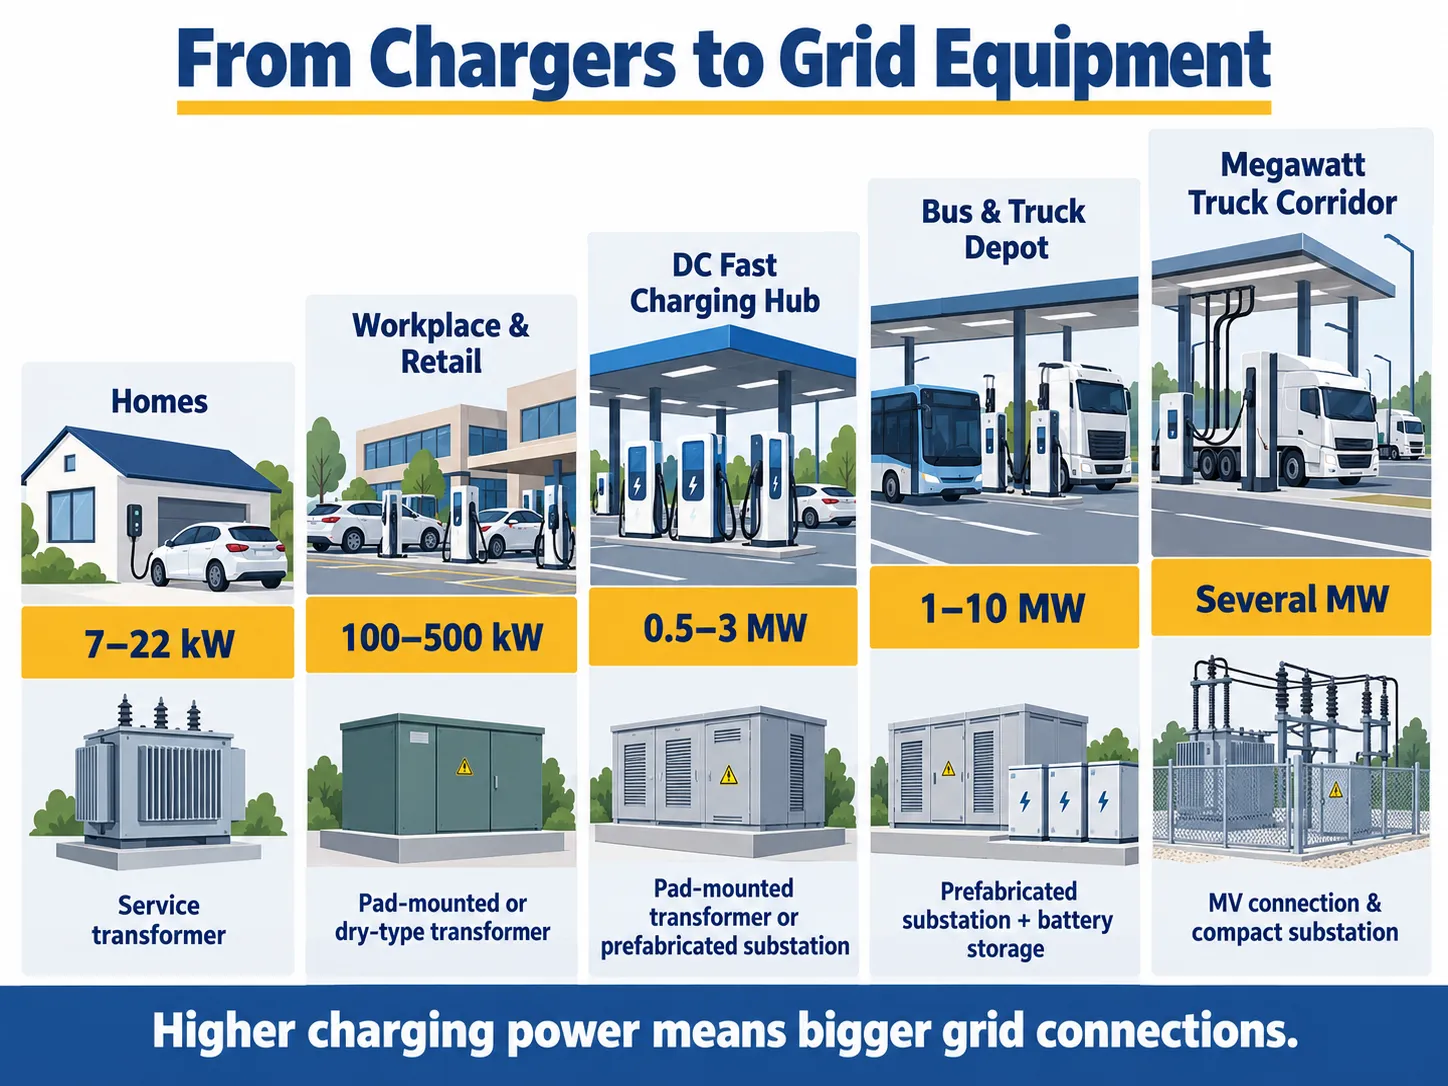
Different charging segments need different equipment. The table below summarizes typical configurations; actual ratings depend on the charger mix, load management and local grid rules.
| Charging segment | Typical site power | Typical electrical equipment |
|---|---|---|
| Homes and apartment buildings | 7 to 22 kW per charger | Existing or upgraded service transformers; building LV distribution |
| Workplace and retail Level 2 or AC hubs | 100 to 500 kW per site | Pad-mounted or dry-type transformer, typically 250 to 800 kVA |
| Urban and highway DC fast charging | 0.5 to 3 MW per site | Dedicated pad-mounted transformer or prefabricated substation, roughly 630 to 3,150 kVA |
| Bus and truck depots | 1 to 10 MW or more | Prefabricated substation with MV switchgear, often several transformers and sometimes battery storage |
| Megawatt truck charging corridors | Several MW per site | Dedicated MV connection, compact or primary substation, often 20 or 33 kV equipment |
Pad-Mounted Transformers for Public Charging
Most outdoor charging sites up to a few megawatts use a three-phase pad-mounted transformer placed close to the chargers. It is compact, tamper-resistant and easy to install on a concrete pad. Subian Electric builds transformadores montados en base trifásicos configurados para el voltaje de red y estándar de cada proyecto.
Dry-Type Transformers for Indoor and Underground Sites
Multi-storey car parks, basements and buildings often call for transformers without liquid insulation for fire safety. Cast-resin transformadores de tipo seco avoid oil containment and need little maintenance, which suits indoor charging hubs.
Prefabricated Substations for Large Hubs and Depots
Large fast-charging hubs and depots usually need medium-voltage switchgear, one or more transformers and a low-voltage board. A factory-built unit such as Subian’s subestación prefabricada serie YB delivers these in one tested enclosure, while subestaciones compactas de 33 kV suit sites connected at higher distribution voltages. Our guía de subestaciones compactas explains how to specify them.
Battery Storage at Charging Sites
Where the grid connection is the limiting factor, many operators add batteries to cover short peaks. That adds a power conversion system and usually another transformer or compact substation. Our article on the subestación compacta de almacenamiento de energía covers how these are integrated.
Worked Example: How Managed Charging Changes a Depot Connection
The IEA’s finding that off-peak scheduling can cut depot demand by up to 60 percent has a direct effect on EV charging transformer size. Consider a bus or truck depot with twenty 150 kW DC chargers, assuming 95 percent charger efficiency, a 0.98 power factor and a 15 percent design margin.
| Paso | All chargers at full power | Managed, 60 percent lower peak |
|---|---|---|
| Peak DC output | 20 × 150 kW = 3,000 kW | 1,200 kW |
| Apparent power at the grid | About 3,222 kVA | About 1,289 kVA |
| Con un margen del 15 por ciento | About 3,706 kVA | About 1,482 kVA |
| Typical equipment choice | 4,000 kVA, or two 2,000 kVA units in a prefabricated substation | One 1,600 kVA transformer |
Operating the charging schedule does not change the energy required by the fleet in the evening but it can reduce the transformer power requirements by more than half compared to the original transformer sizing and it may avoid the line or substation upgrade completely. Thus depot operators need to agree upon charging schedule with a utility company before the equipment order is placed. This example is not a design – the actual projects also check the harmonics and impedance values, short-circuit levels and local grid rules for the specific project. For complete overview of fast charge sizing process refer to our DOE report guide.
Grid Standards and Voltages Differ by Market
Porque EV charging infrastructure is growing fastest in markets with very different grid traditions, equipment has to be matched to each one.
| Mercado | Voltajes de distribución típicos | Frecuencia | Main equipment standards |
|---|---|---|---|
| China | 10 and 35 kV | 50 Hz | GB standards, broadly aligned with IEC |
| Europe, Middle East, Africa, much of Asia | 10, 11, 20, 22 y 33 kV | 50 Hz | IEC 60076 for transformers, IEC 62271-202 for prefabricated substations |
| United States and Canada | 47, 13.2, 24.9 y 34.5 kV | 60 Hz | IEEE C57 series and utility specifications |
| América Latina | Varies by country, commonly 13.2 to 34.5 kV | 50 or 60 Hz | IEC or IEEE, depending on country and utility |
Subian Electric builds mainly to IEC standards for projects across Asia, Africa, the Middle East and Latin America. North American requirements can be engineered on a project basis, but voltage, insulation level, configuration and utility acceptance should be confirmed at the start of every enquiry.
Future of the EV Charging Industry in 2026
The International Energy Agency predicts that the total number of electric vehicles sold around the world by 2026 is expected to be about 23 million, which will account for approximately 28% of all car sales. This prediction was shaped despite a 8% downturn in sales in the first quarter compared to the same period of the last year that was caused by low demand in China and America. Europe saw an increase in sales by approximately 30% compared to the first quarter of the previous year, while the rest Asia Pacific experienced a growth by 80% and Latin America – by 75%.
When it comes to charging infrastructure, we can see three major trends. First, the average sales will move towards developing markets in Asia-Pacific region, India and Latin America. Secondly, the share of new ultra-fast road charging stations and heavy duty industrial charging stations will increase. And the most important point is that the decision to open new charging stations will be made not based on the availability of chargers, but on the state of the electrical grid. Besides, government policy plays a significant role. In the USA, for instance, the federal tax incentive for home charging systems is about to expire, while by the beginning of 2026 the NEVI program has introduced about 550 fast charging stations operating in 19 states and about another 1,000 stations already funded.
Preguntas Frecuentes
What does the EV charging market report 2025 show?
According to the IEA’s assessment of 2025, there are more than 7 million public charging points across the globe, as nearly 1.8 million of such points were added in the year which shows an increase of 33 percent. China has had approximately 65 percent of the stock, and the average public charging point has nearly reached 50kW.
Which report has the 2025 EV charging data, the Global EV Outlook 2025 or 2026?
The Global EV Outlook 2026, published in spring 2026, contains the full 2025 results. The 2025 edition mainly reviews the 2024 market, when public charging points passed 5 million.
How many public EV chargers does the United States have?
About 235,000 public light-duty charging points at the end of 2025, including nearly 70,000 fast and ultra-fast points, which grew 30 percent during the year.
Why does EV charging growth increase transformer demand?
Every charging station requires grid connectivity, with more powerful stations consuming a greater amount of energy. Generally, a fast charging hub of several megawatts will require a pad transformer or pre-assembled substation, while large installations may require a number of transformers and medium voltage switchgear.
What transformer size does an EV charging depot need?
It depends on charger power, numbers and how charging is scheduled. In the example above, twenty 150 kW chargers need about 3.7 MVA if all run at once, but about 1.5 MVA if managed charging cuts the peak by 60 percent.
Which region is growing fastest?
China added the most chargers, but many of the fastest growth rates came from emerging markets. Electric car sales more than doubled in Southeast Asia in 2025, and public fast chargers in Malaysia grew more than 70 percent.
Referencias
- International Energy Agency: Global EV Outlook 2026, Electric Vehicle Charging
- International Energy Agency: Global EV Outlook 2026, Executive Summary
- International Energy Agency: Global EV Outlook 2025, Electric Vehicle Charging
- Charging station, Wikipedia
The 2025 numbers make one thing clear: the EV charging market is growing in power as fast as it is growing in numbers, and every new site depends on the right grid equipment. Jiangsu Subian Electric Power Equipment Co., Ltd. designs and builds pad-mounted and dry-type transformers, prefabricated substations and subestaciones de nueva energía for charging hubs, fleet depots and storage projects, configured to your network voltage and standard. For private-label or distributor supply, see our programa OEM y ODM. Send your charger list, grid voltage and site conditions through our página de contacto, y nuestros ingenieros responderán con un chequeo de tamaño, dibujos y una cotización de fábrica.