


短いバージョンでは:2025年はEV充電に関しても同様に印象的でした。国際エネルギー機関の報告によると、年末までに世界には700万以上の公共充電ステーションがあり、今年は180万台近くが設置され、33%以上の増加となっています。すべての設備の65%は中国に設置されており、公共充電器の平均出力は約50 kWに上昇し、急速充電器と超急速充電器の設置は遅い充電器よりもはるかに多くなっています。電気自動車の販売台数は2000万台を超え、世界中で販売される車の4台に1台がEVです。.
これらの充電器には、変圧器、スイッチギア、そして地域の電力網への接続といった電気設備が必要です。この報告書は EV充電報告書 2025 の主な情報を要約し、主要な世界地域間の比較を提供し、急速充電器の設置傾向を示し、その成長が変圧器や変電所に与える影響を明らかにします。これは私たちのEV充電シリーズの第2回目の記事であり、最初の記事では DOEの研究が配電変圧器とフィーダーのアップグレードについて何を言っているかを説明しています。.
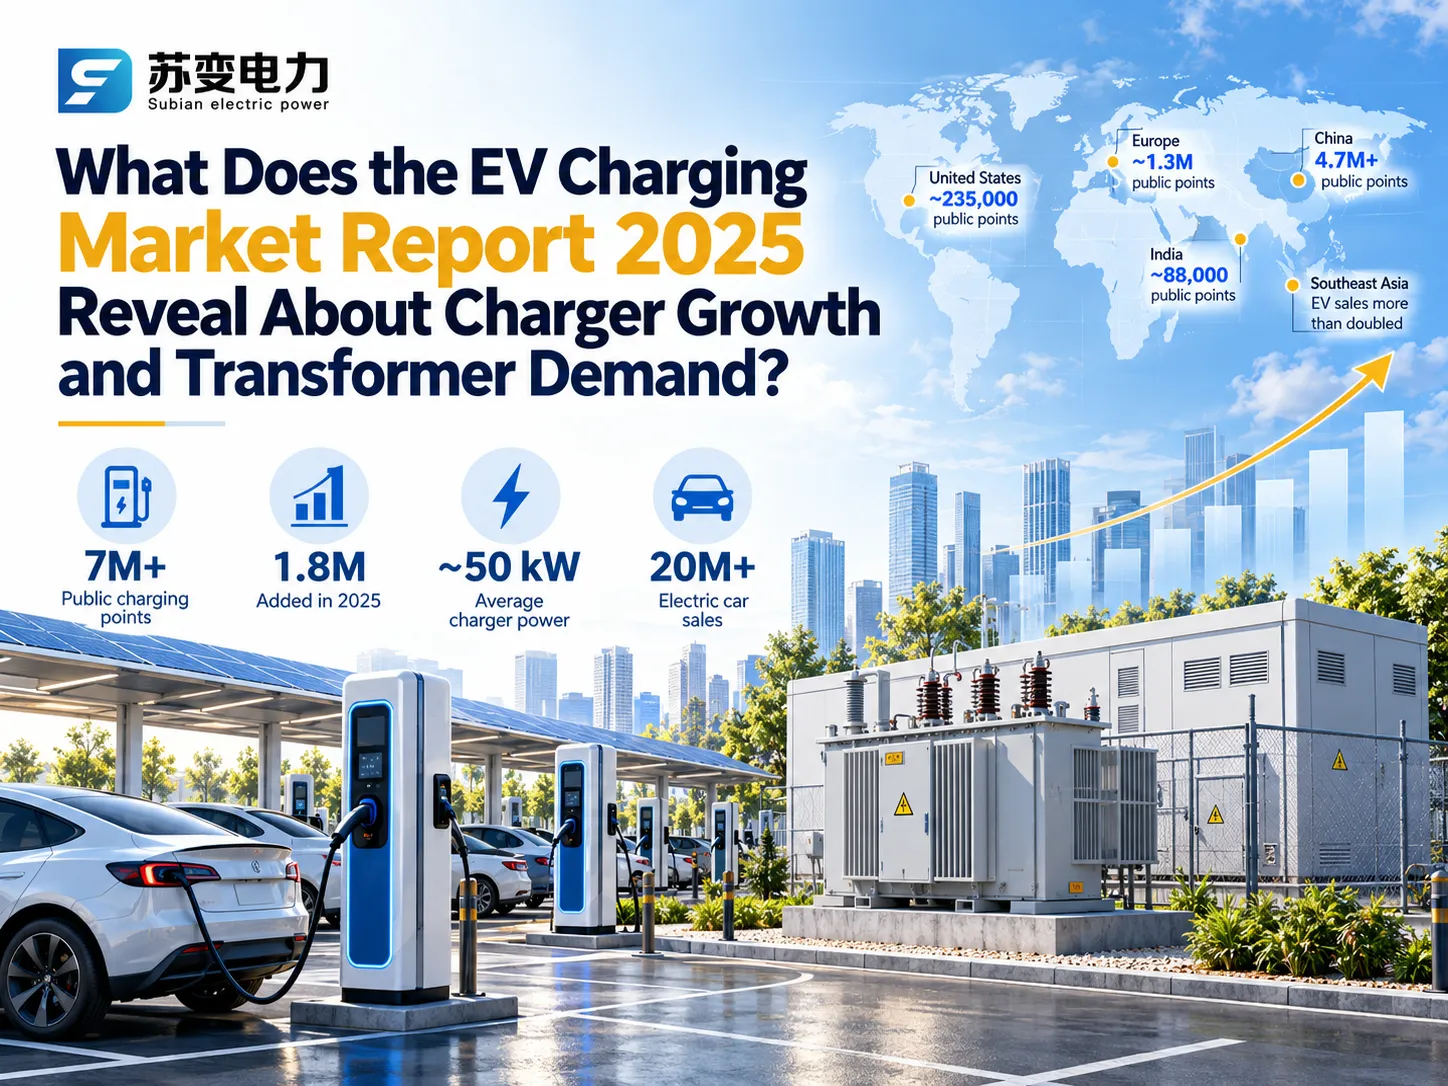
どの報告書が実際に2025年のEV充電市場をカバーしているのか?
誤解の原因は報告書の年です。グローバルEVアウトルックは毎年春にIEAによって発表されます。したがって、現在進行中の報告書の最新版は2025年版です。このように、報告書のいかなる版も前年の情報を提供します。.
| 報告書 | 公開 | 審査する市場年 | ヘッドライン充電数 |
|---|---|---|---|
| IEAグローバルEVアウトルック 2025 | 2025年春 | 2024 | 500万以上の公共充電ポイント、2024年に130万以上追加 |
| IEAグローバルEVアウトルック 2026 | 2026年春 | 2025 | 700万以上の公共充電ポイント、2025年に180万近く追加 |
本質的に、2025年の EV充電において実際に何が起こったのかを知りたい場合は、2026年版の報告書を読む必要があります。そうでなければ、この記事の統計は特に指定がない限り、この最新版から導き出されています。, 2025年のグローバルEV充電市場:主要な数字.
2025年末
| 指標 | 2024年からの変化 | 世界の公共充電ポイント |
|---|---|---|
| 700万以上 | 33%以上の増加、180万近く追加 | 軽自動車用EVの私用充電ポイント |
| 4300万以上 | 約7600万台の電気軽自動車に対応 | 公共充電ポイントあたりの電気自動車 |
| 約11 | 2024年と同様 | 平均公共充電器出力 |
| ほぼ50 kW | 40 kWをわずかに超えた数値から15%増加 | 電気自動車あたりの公共充電能力 |
| 5 kW | 4 kWから増加 | 電気自動車の販売 |
| 2000万以上 | 約20%増加、新車の約4台に1台 | 電気トラックの販売シェア |
| 世界のトラック販売の9% | 2倍以上に増加 | 2倍以上 |
電気インフラを計画する際、これらの数字のうち2つが特に重要です。車両数と充電器数の比率はほとんど変わらず、平均的な充電器が以前よりも速く充電できることは、充電器の展開が車両の販売に対して遅れをとることなくバランスが取れていることを示しています。充電ネットワークは数量が増えるだけでなく、電力的にもより重要になります。.
充電行動は、全体の状況の存在を示しています。世界中のEVオーナーが充電時間の約75%をプライベートな方法で充電し、この時間の約10%だけを公共の急速充電ステーションを訪れると報告されています。.
EV充電市場の地域別の違い
| 地域 | 公共充電ポイント、2025年 | 成長と主要トレンド | 公共ポイントあたりのEV数 |
|---|---|---|---|
| 中国 | 470万以上 | 約130万台追加;高速および超高速ポイントは40%増加し220万台に達する | 10 |
| ヨーロッパ | 約130万台 | 約20%増加し、約26万台追加;EUの超高速ポイントは30%増加 | EUで11 |
| アメリカ合衆国 | 約23万5千台 | 記録的な追加;高速および超高速ポイントは30%増加し、ほぼ7万台に達する | 33 |
| インド | 約8万8千台 | 15%増加;全国プログラムは22,100の高速充電器を目指す | 記載なし |
| 韓国 | 高速および超高速:約51,000 | 高速ポイントは10%増加;EVあたりの容量は9 kWを超える | ‚’少し超える |
ヨーロッパの合計は、2024年末に100万ポイント以上、2025年に約26万台追加されるという推定に基づいています。.
中国:増加と速度
2025年、中国は他の国を合わせたよりも多くの公共充電器を追加し、世界的に75%以上の成長を達成しました。さらに、国内の公共充電器の平均出力は55 kWを超え、公共の容量は電気自動車1台あたりほぼ6 kWです。これは主に住宅の顧客によって決定されます。中国の電気自動車所有者の半数だけが家庭用充電器を持ち、他の顧客は共有の住宅用充電器にアクセスしています。したがって、公共の高速充電の役割は、より多くの独立した住宅がある市場と比較して重要性が増しています。.
ヨーロッパ:開発と超高速回廊
ヨーロッパの公共充電の成長はより安定しており、約20%でした。オランダが最初で、約21万ポイントの公共充電器を持ち、次にドイツが19万6千、フランスが18万5千、イギリスは11万6千を超え、30%以上の成長を達成しました。主なトレンドは高速道路に見られます;EUの代替燃料インフラ規則に従い、主要な輸送回廊に沿って比較的小さな間隔で高速充電プールが必要です。さらに、EUの超高速ポイントは2025年に30%増加しました。さらに、ヨーロッパの公共容量はまだ発展の傾向があります。.
アメリカ合衆国:高速充電のリーダーシップとカバレッジの遅れ
アメリカは公共充電器に関して素晴らしい年を迎え、前年と比較して20%以上が追加され、高速および超高速の開発はほぼ7万ポイントに達しました。しかし、この国には世界的に約3%の公共充電器があり、約10%のEVがあります。これは、1つの公共充電器に対して33台の車両があることを意味し、2020年にはこの比率は20未満でした。アメリカのほとんどの顧客は自宅で充電しており、高速道路やフリートの場合の公共充電への投資の潜在能力がまだあることを示しています。.
新興市場:最も成長の早い国
成長率が最も高かったのは、数年前に結果が少なかった国々でした。特に、東南アジアではEVの販売が倍増し、ラテンアメリカでは2025年までに約75%の成長を遂げました。タイにはほぼ12,000の公共充電器があり、そのうち60%以上が急速充電器です。マレーシアでは公共の急速充電器が70%以上増加しました。インドネシアの公共事業は4,500以上の公共充電器を設置し、ブラジルは公共充電器の数を約35%増加させることに成功しました。示された国々のいくつかでは、充電器の成長がEVの成長に遅れをとっています。.
DC急速充電のトレンド:より速い充電器、高い電圧
市場で最も注目すべき技術トレンドの一つは、より高い電力レベルへの移行です。平均的な公共充電器は、わずか1年で40キロワットを超えるからほぼ50キロワットに跳ね上がりました。また、DC急速充電のアウトレットは、すべての主要な地域で遅い充電アウトレットよりも速く成長しています。.
車両は充電ステーションに追いついてきています。2025年までに、約160種類のバッテリー駆動の電気自動車が150キロワット以上の充電が可能になる予定であり、この期間中に1,000ボルトのモデルも利用可能になりました。2026年初頭に、BYDは30MWの容量を持つメガチャージャーを発表しました。一方、国際エネルギー機関は、30%未満の電気自動車が超急速充電を利用でき、250キロワット以上の充電が可能な車両は5%未満であると警告しています。したがって、超急速充電サイトは、既存の車両だけでなく、将来の車両のためにも建設されるべきです。.
電力網の場合、充電ステーションの電力が増加すると、各サイトの規模が変わります。350kWの電力を持つ8つのディスペンサーを備えた高速道路のポイントは、2800kWの電力定格を持ち、小規模な工場の電力負荷に相当します。通常、これは中圧電力網への別の接続と独自の変圧器、しばしば事前に組み立てられた変電所を必要とします。.
重量級およびデポ充電:次の大きな負荷
電気トラックとバスは、充電をキロワットからメガワットにシフトしています。2025年には、電気トラックの販売が2倍以上に増加し、世界の販売の9%に達しました。一方、中国で販売されたトラックの約4分の1が電気トラックでした。.
世界中には50万台以上の電気重トラックがあり、70,000以上の充電ステーションが利用可能です。.
中国では、ほぼ100万台の電気トラックが稼働しています。ほとんどのトラック充電ステーションは300-400kWのレートで運営されており、1,000kWを超えることができるのは約1%です。.
EUには4,000以上のトラック用充電ステーションがあり、ほぼすべての電気トラックは150kW以上のレートで充電されています。EUには1,000kW以上のレートで運営されているステーションが40か所あります。.
ドイツは350の計画された充電ステーションに対して16億ユーロを承認しました。.
2025年までに、米国では中型および大型車両用の充電ステーションを約400箇所設置し、さらに約1,000箇所のステーションを計画しています。.
都市のデポはボトルネックとなっており、IEAの報告によれば、電力網への接続の遅延がバス輸送の電化における最大の障壁の一つです。変電所の容量の制限、許可の遅延、電力網の強化は、都市のデポの展開に数年の遅延をもたらす可能性があるとIEAの報告は述べています。.
700万の充電器が電力網に与える影響
IEAの統計を掛け算することで、充電された電流の重要性がわかります。公共の充電ポイントが700万を超え、平均でほぼ50 kW、約7600万台の電気自動車ごとに4.5 kWの公共容量がある場合、現在の公共充電ネットワークは約340-350 GWの総容量を持っています。これは私たち自身の評価であり、IEAの公式な数字ではありません。しかし、その容量のすべてのキロワットは、配電用変圧器、切替機器、および配線を介して供給される必要があります。追加の容量のほとんどは過去3年間で提供されました。.
将来を見据えると、IEAは2035年までにEVの電力需要が1,500 TWhを超えると予測しており、これは2025年と比較して6倍の増加となります。1,500 TWhの追加は、世界中で異なる影響を及ぼし、全体としては約4%の電力消費の増加を意味します。しかし、ヨーロッパでは総電力消費が10%以上増加し、中国では6%未満の増加となります。 DOE EV充電網研究へのガイド プランナーがサービス変圧器、フィーダー、または変電所の強化が必要かどうかを決定する方法を説明します。.
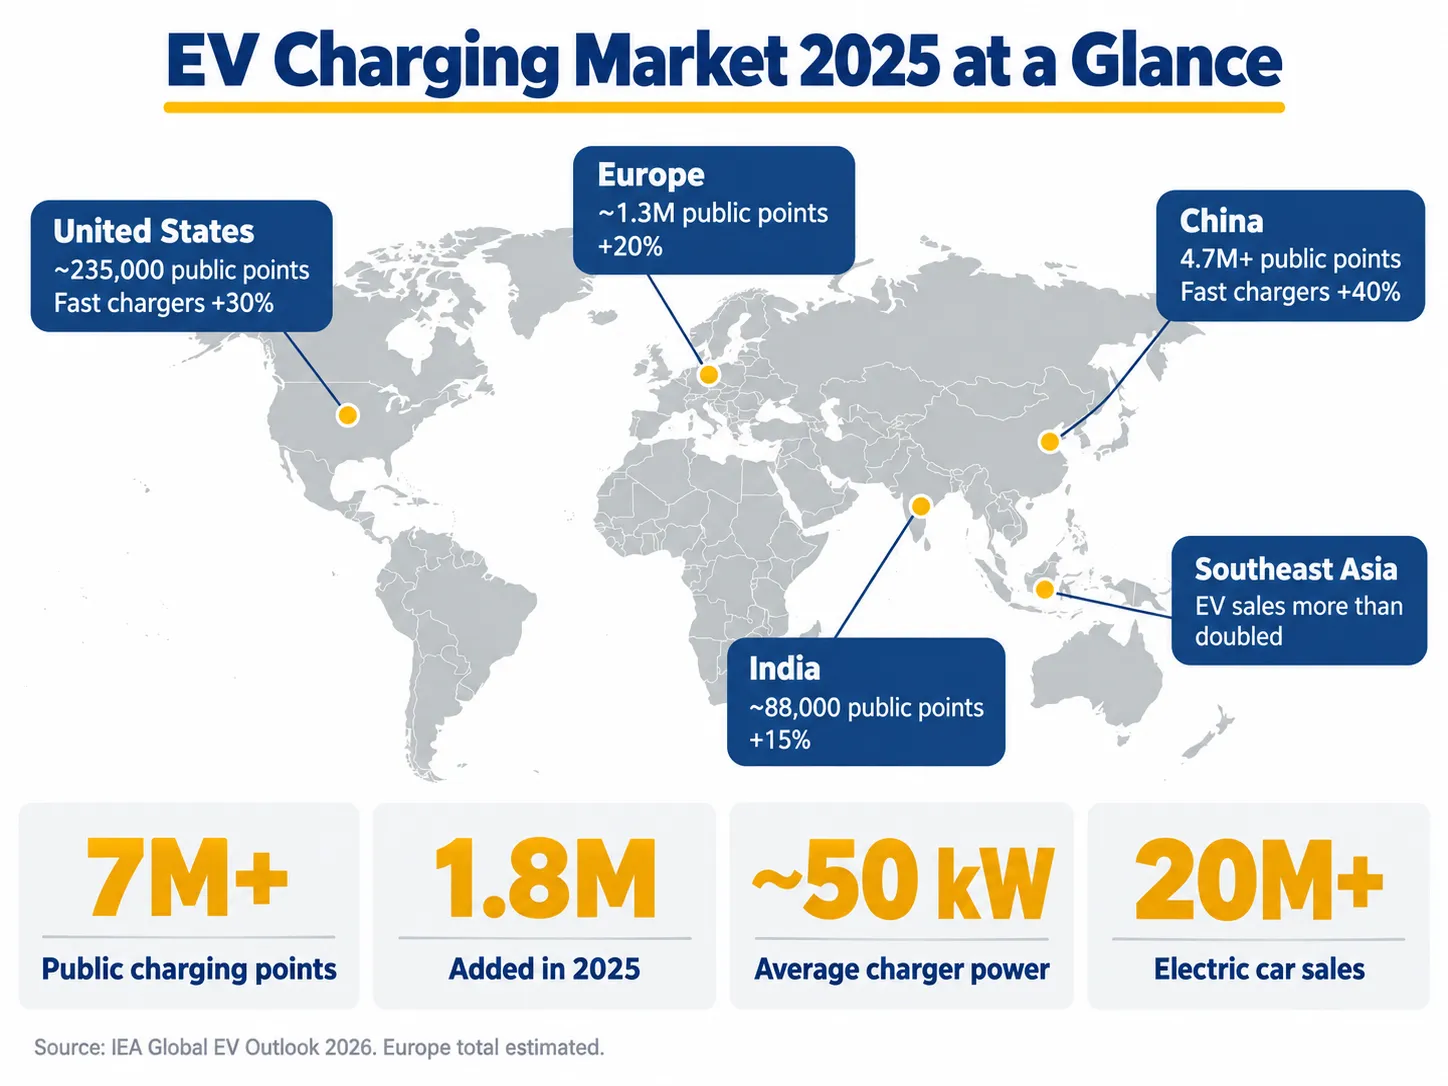
EV充電の成長が変圧器と変電所の需要を生む場所
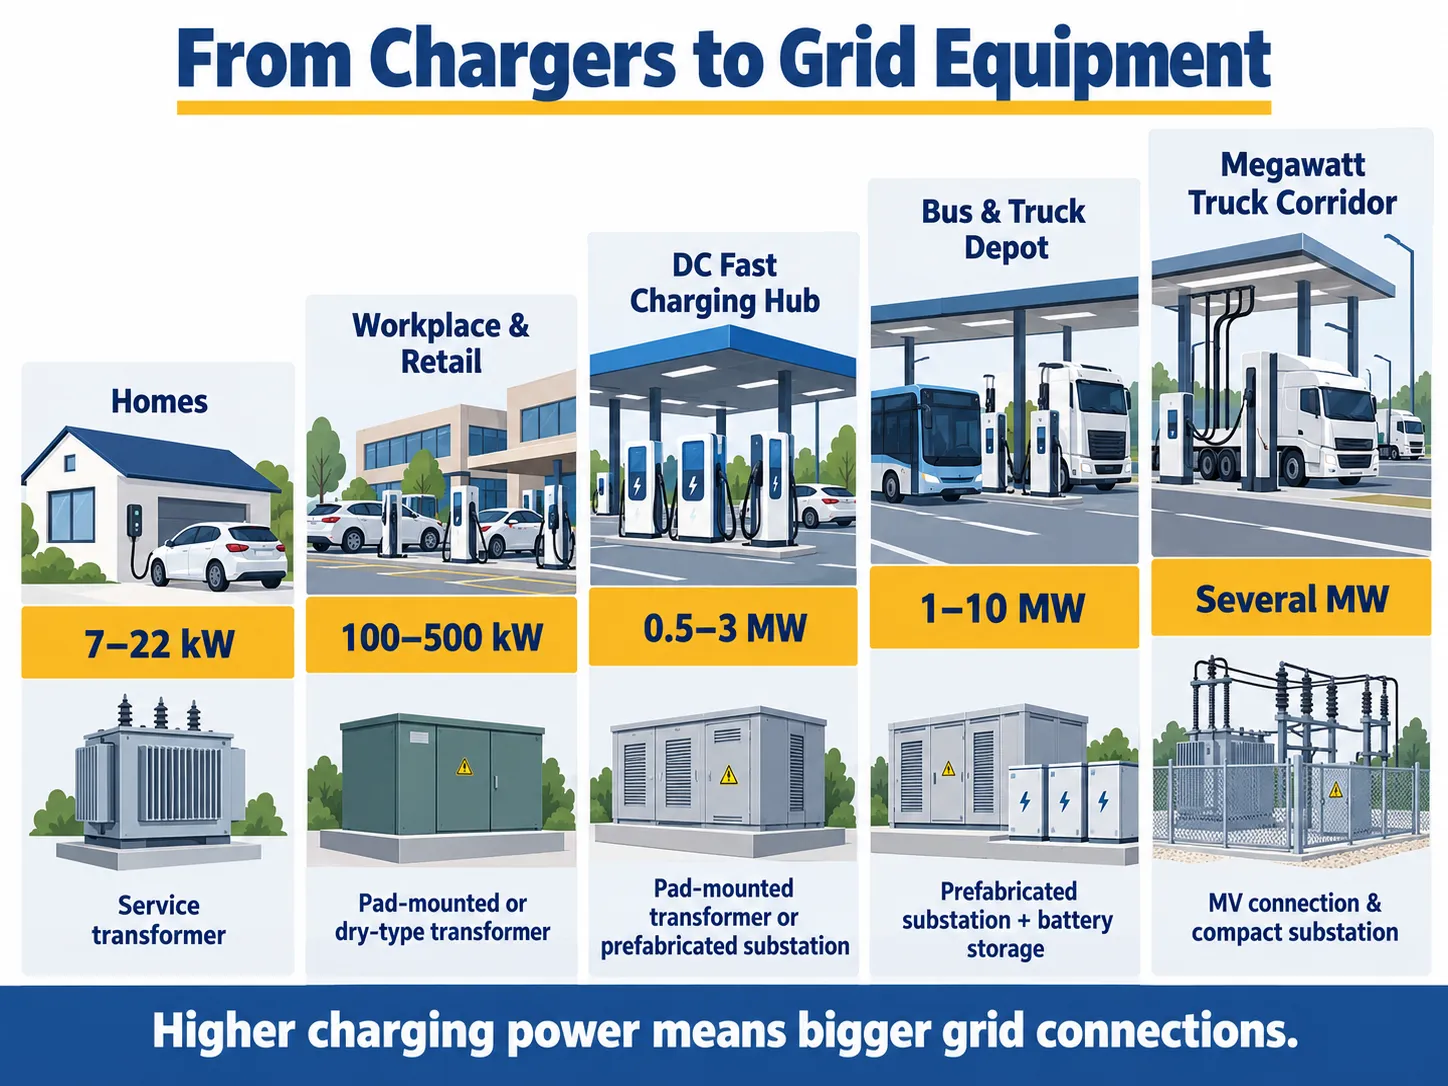
異なる充電セグメントには異なる機器が必要です。以下の表は典型的な構成をまとめたもので、実際の定格は充電器の種類、負荷管理、および地域の電力網の規則に依存します。.
| 充電セグメント | 典型的なサイト電力 | 典型的な電気機器 |
|---|---|---|
| 家庭およびアパートビル | 充電器ごとに7から22 kW | 既存またはアップグレードされたサービス変圧器;建物の低電圧配電 |
| 職場および小売のレベル2またはACハブ | サイトごとに100から500 kW | Pad-mounted or dry-type transformer, typically 250 to 800 kVA |
| Urban and highway DC fast charging | 0.5 to 3 MW per site | Dedicated pad-mounted transformer or prefabricated substation, roughly 630 to 3,150 kVA |
| Bus and truck depots | 1 to 10 MW or more | Prefabricated substation with MV switchgear, often several transformers and sometimes battery storage |
| Megawatt truck charging corridors | Several MW per site | Dedicated MV connection, compact or primary substation, often 20 or 33 kV equipment |
Pad-Mounted Transformers for Public Charging
Most outdoor charging sites up to a few megawatts use a three-phase pad-mounted transformer placed close to the chargers. It is compact, tamper-resistant and easy to install on a concrete pad. Subian Electric builds 三相パッドマウント変圧器 各プロジェクトのネットワーク電圧と標準に合わせて構成されています。.
Dry-Type Transformers for Indoor and Underground Sites
Multi-storey car parks, basements and buildings often call for transformers without liquid insulation for fire safety. Cast-resin ドライタイプ変圧器 avoid oil containment and need little maintenance, which suits indoor charging hubs.
Prefabricated Substations for Large Hubs and Depots
Large fast-charging hubs and depots usually need medium-voltage switchgear, one or more transformers and a low-voltage board. A factory-built unit such as Subian’s YBシリーズプレハブ変電所 delivers these in one tested enclosure, while 33 kVコンパクト変電所を構築しています。 suit sites connected at higher distribution voltages. Our コンパクト変電所ガイド explains how to specify them.
Battery Storage at Charging Sites
Where the grid connection is the limiting factor, many operators add batteries to cover short peaks. That adds a power conversion system and usually another transformer or compact substation. Our article on the エネルギー貯蔵コンパクト変電所 covers how these are integrated.
Worked Example: How Managed Charging Changes a Depot Connection
The IEA’s finding that off-peak scheduling can cut depot demand by up to 60 percent has a direct effect on EV charging transformer size. Consider a bus or truck depot with twenty 150 kW DC chargers, assuming 95 percent charger efficiency, a 0.98 power factor and a 15 percent design margin.
| ステップ | All chargers at full power | Managed, 60 percent lower peak |
|---|---|---|
| Peak DC output | 20 × 150 kW = 3,000 kW | 1,200 kW |
| Apparent power at the grid | About 3,222 kVA | About 1,289 kVA |
| 15%のマージンを含む | About 3,706 kVA | About 1,482 kVA |
| Typical equipment choice | 4,000 kVA, or two 2,000 kVA units in a prefabricated substation | One 1,600 kVA transformer |
Operating the charging schedule does not change the energy required by the fleet in the evening but it can reduce the transformer power requirements by more than half compared to the original transformer sizing and it may avoid the line or substation upgrade completely. Thus depot operators need to agree upon charging schedule with a utility company before the equipment order is placed. This example is not a design – the actual projects also check the harmonics and impedance values, short-circuit levels and local grid rules for the specific project. For complete overview of fast charge sizing process refer to our DOE report guide.
Grid Standards and Voltages Differ by Market
なぜなら EV charging infrastructure is growing fastest in markets with very different grid traditions, equipment has to be matched to each one.
| 市場 | 一般的な配電電圧 | 周波数 | Main equipment standards |
|---|---|---|---|
| 中国 | 10 and 35 kV | 50 Hz | GB standards, broadly aligned with IEC |
| Europe, Middle East, Africa, much of Asia | 10, 11, 20, 22 and 33 kV | 50 Hz | IEC 60076 for transformers, IEC 62271-202 for prefabricated substations |
| United States and Canada | 47、13.2、24.9および34.5 kV | 60 Hz | IEEE C57 series and utility specifications |
| ラテンアメリカ | Varies by country, commonly 13.2 to 34.5 kV | 50 or 60 Hz | IEC or IEEE, depending on country and utility |
Subian Electric builds mainly to IEC standards for projects across Asia, Africa, the Middle East and Latin America. North American requirements can be engineered on a project basis, but voltage, insulation level, configuration and utility acceptance should be confirmed at the start of every enquiry.
Future of the EV Charging Industry in 2026
The International Energy Agency predicts that the total number of electric vehicles sold around the world by 2026 is expected to be about 23 million, which will account for approximately 28% of all car sales. This prediction was shaped despite a 8% downturn in sales in the first quarter compared to the same period of the last year that was caused by low demand in China and America. Europe saw an increase in sales by approximately 30% compared to the first quarter of the previous year, while the rest Asia Pacific experienced a growth by 80% and Latin America – by 75%.
When it comes to charging infrastructure, we can see three major trends. First, the average sales will move towards developing markets in Asia-Pacific region, India and Latin America. Secondly, the share of new ultra-fast road charging stations and heavy duty industrial charging stations will increase. And the most important point is that the decision to open new charging stations will be made not based on the availability of chargers, but on the state of the electrical grid. Besides, government policy plays a significant role. In the USA, for instance, the federal tax incentive for home charging systems is about to expire, while by the beginning of 2026 the NEVI program has introduced about 550 fast charging stations operating in 19 states and about another 1,000 stations already funded.
よくある質問
What does the EV charging market report 2025 show?
According to the IEA’s assessment of 2025, there are more than 7 million public charging points across the globe, as nearly 1.8 million of such points were added in the year which shows an increase of 33 percent. China has had approximately 65 percent of the stock, and the average public charging point has nearly reached 50kW.
Which report has the 2025 EV charging data, the Global EV Outlook 2025 or 2026?
The Global EV Outlook 2026, published in spring 2026, contains the full 2025 results. The 2025 edition mainly reviews the 2024 market, when public charging points passed 5 million.
How many public EV chargers does the United States have?
About 235,000 public light-duty charging points at the end of 2025, including nearly 70,000 fast and ultra-fast points, which grew 30 percent during the year.
Why does EV charging growth increase transformer demand?
Every charging station requires grid connectivity, with more powerful stations consuming a greater amount of energy. Generally, a fast charging hub of several megawatts will require a pad transformer or pre-assembled substation, while large installations may require a number of transformers and medium voltage switchgear.
What transformer size does an EV charging depot need?
It depends on charger power, numbers and how charging is scheduled. In the example above, twenty 150 kW chargers need about 3.7 MVA if all run at once, but about 1.5 MVA if managed charging cuts the peak by 60 percent.
Which region is growing fastest?
China added the most chargers, but many of the fastest growth rates came from emerging markets. Electric car sales more than doubled in Southeast Asia in 2025, and public fast chargers in Malaysia grew more than 70 percent.
参考文献
- International Energy Agency: Global EV Outlook 2026, Electric Vehicle Charging
- International Energy Agency: Global EV Outlook 2026, Executive Summary
- International Energy Agency: Global EV Outlook 2025, Electric Vehicle Charging
- Charging station, Wikipedia
The 2025 numbers make one thing clear: the EV charging market is growing in power as fast as it is growing in numbers, and every new site depends on the right grid equipment. Jiangsu Subian Electric Power Equipment Co., Ltd. designs and builds pad-mounted and dry-type transformers, prefabricated substations and 充電および貯蔵プロジェクトのための新エネルギー変電所 for charging hubs, fleet depots and storage projects, configured to your network voltage and standard. For private-label or distributor supply, see our OEMおよびODMプログラム. Send your charger list, grid voltage and site conditions through our お問い合わせページ, に送信すると、私たちのエンジニアがサイズチェック、図面、工場見積もりを返信します。.