


يواجه فرد في منصب مدير يتعامل مع المشتريات في لاغوس قرارًا مهمًا بشأن توقيع اتفاقية لتحويلات التوزيع تستمر لمدة عامين قادمين. علاوة على ذلك، يتخذ محترف من جاكرتا قرارًا مشابهًا بشأن شراء معدات محطة تحويل. يتلقى كلا الموظفين نفس المعلومات التي تفيد بأن الصين تزيد من عمليات إنتاج الطاقة الخاصة بها وأن الطلبات الكبيرة لتصنيع المحولات قد بدأت بالفعل في الظهور كأوقات تسليم.
من أجل تمييز المعلومات ذات الصلة عن الضوضاء غير الضرورية، يقدم CEC (مجلس الكهرباء الصيني) للجمهور وثيقتين مهمتين تتعلقان بتطورات الطاقة الكهربائية في الصين.
يقدم المقال تحليلًا شاملاً للأوراق الصادرة عن CEC، بما في ذلك تقرير التنمية السنوي لصناعة الطاقة الكهربائية في الصين لعام 2024 وتقرير تحليل وتوقعات حالة العرض والطلب على الكهرباء الوطنية 2023-2024، ويركز على الأرقام الرئيسية التي تعتبر حاسمة لاتخاذ قرارات الشراء. في التقرير، سيجد الجمهور معلومات عن القدرة المركبة وهيكل توليد الكهرباء، والتوقعات الصادرة عن CEC في عام 2024، والاستثمارات في البنية التحتية التي قامت بها الصين والمعنى ذي الصلة لجميع هذه الأرقام بالنسبة للأسعار وشروط التسليم.
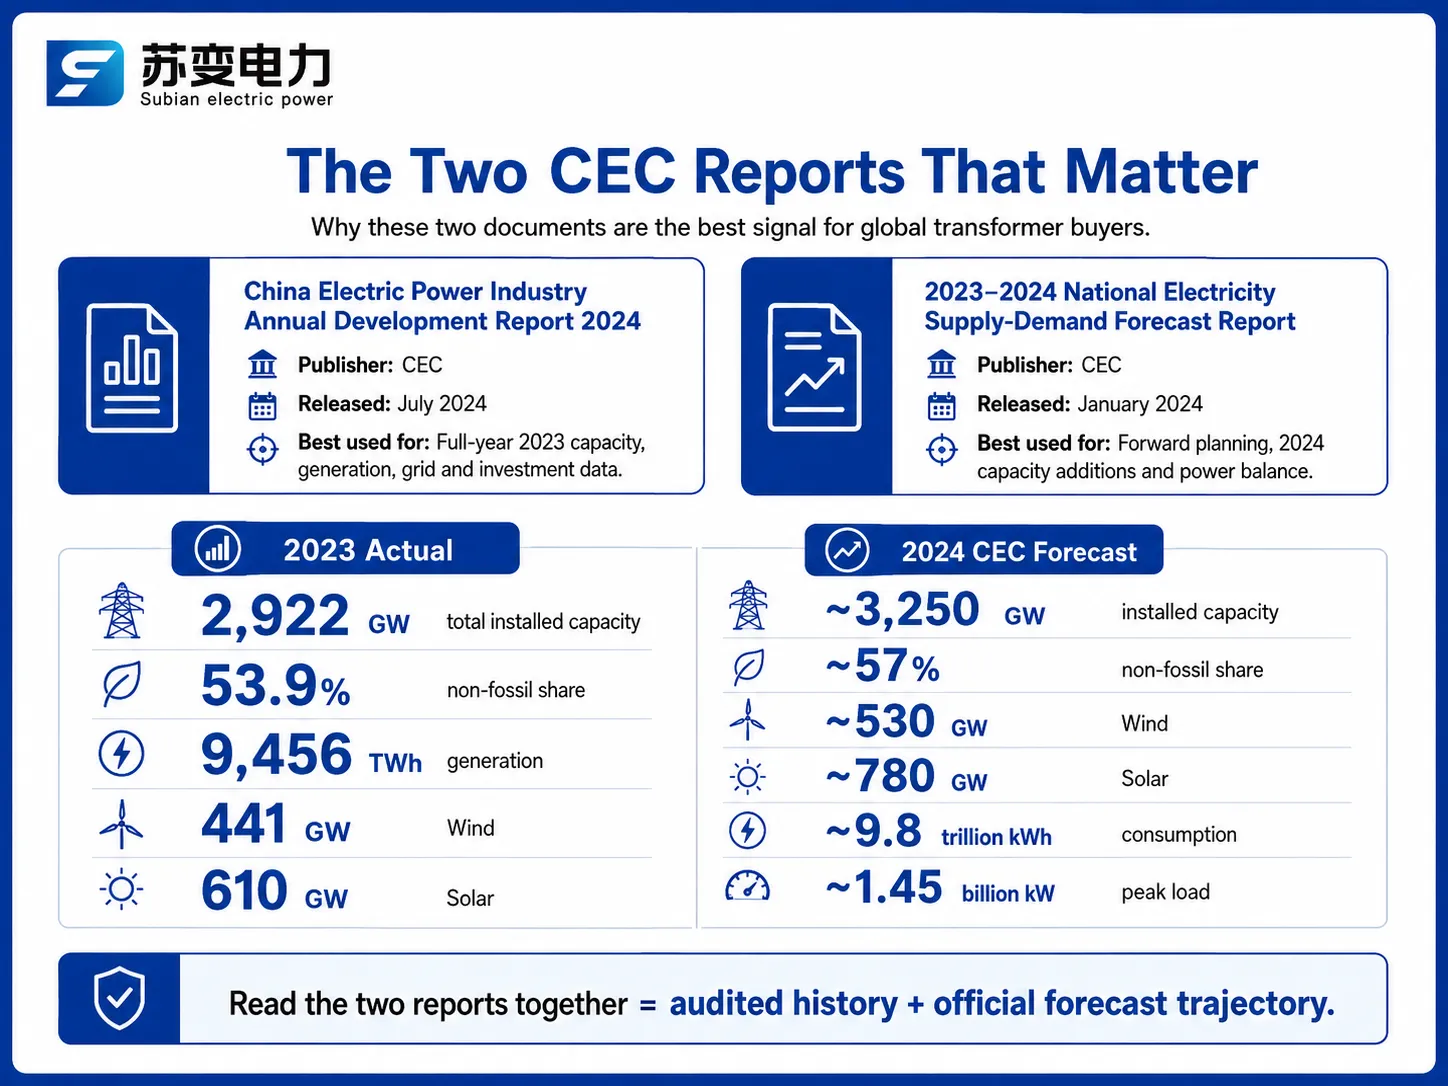
التقريران: ما هما ومن ينشرهما
كل عام، ينشر CEC، أكبر جمعية لصناعة الطاقة في الصين، تقريرين رئيسيين. الأول، تقرير التنمية السنوي لصناعة الطاقة الكهربائية في الصين، يُصدر حوالي منتصف العام. يلخص إحصائيات العام السابق، بما في ذلك القدرات المركبة والتوليد، وطول خطوط الطاقة، وقدرة المحطات الفرعية، وتدفقات الاستثمار. تم نشر التقرير الأكثر حداثة لعام 2024 في يوليو 2024، ويحتوي على معلومات موثوقة لعام 2023.
التقرير الثاني هو تقرير تحليل وتوقعات حالة العرض والطلب على الكهرباء الوطنية. يتم نشر هذا التقرير كل يناير ويغطي التوقعات التي تم إعدادها للسنوات القادمة. تم إصدار التقرير الأكثر حداثة في 30 يناير 2024 واحتوى على توقعات تتعلق باستهلاك الكهرباء، وزيادة القدرة، وتوازن العرض والطلب لشهور الصيف والشتاء. عند تحليل كلا التقريرين معًا، فإنهما يوفران محاسبة مفصلة وتوقعات مستقبلية يحتاجها المشتري.
| تقرير | الناشر والتاريخ | يغطي | الأفضل للاستخدام |
|---|---|---|---|
| تقرير التنمية السنوي لصناعة الطاقة الكهربائية في الصين لعام 2024 | CEC، يوليو 2024 | القدرة الكاملة لعام 2023، التوليد، الشبكة، الاستثمار | المعايير التاريخية، تأكيد الاتجاه |
| تقرير توقعات حالة العرض والطلب على الكهرباء الوطنية 2023-2024 | CEC، يناير 2024 | مراجعة 2023 + استهلاك 2024، قدرة، توازن | التخطيط المستقبلي، تحديد الطلب |
القدرة المركبة لعام 2023: 2.9 تيروات وعداد مستمر
الرقم الرئيسي المميز في التقرير السنوي هو قدرة التوليد المثبتة البالغة 2,922 GW في نهاية عام 2023، بزيادة قدرها 14.0% عن العام السابق. وهذا يعادل حوالي 2.1 كيلووات لكل شخص في الصين؛ وهذه هي المرة الأولى التي تتجاوز فيها قدرة التوليد المثبتة في الصين عتبة 2 كيلووات/شخص. لأغراض المقارنة، كانت الزيادة في القدرة المثبتة في جميع أنحاء العالم، باستثناء الصين، أقل بكثير، وهذه واحدة من الأسباب التي جعلت مصنعي المحولات الصينيين يمثلون غالبية الإنتاج الصناعي على مستوى العالم.
| نوع التوليد | القدرة المثبتة (نهاية 2023) | على أساس سنوي | حصة من الإجمالي |
|---|---|---|---|
| الإجمالي | 2,922 جيجاوات | +14.0% | 100% |
| حراري (بما في ذلك الفحم) | 1,391 جيجاوات | +4.2% | 47.6% |
| - فحم | 1,165 جيجاوات | +3.4% | 39.9% |
| الطاقة الكهرومائية | 422 جيجاوات | +2.0% | 14.5% |
| الرياح (متصلة بالشبكة) | 441 جيجاوات | +20.7% | 15.1% |
| الطاقة الشمسية الكهروضوئية (متصلة بالشبكة) | 610 جيجاوات | +55.5% | 20.9% |
| نووي | 57 جيجاوات | +2.4% | 1.9% |
من المهم التركيز على إحصائيتين. مع الجمع بين الطاقة الشمسية والرياح، وصلوا إلى 1,050 GW، متجاوزين 1 تيروات. أظهر عدد أنظمة الطاقة الشمسية زيادة قدرها 217 GW في عام واحد. جميع محطات الرياح والطاقة الشمسية المذكورة أعلاه تحتاج إلى محولات رفع وجميع اتصالاتها تحتاج إلى معدات تبديل التغذية، ولهذا السبب يمكننا استخدام مؤشرات طلب المعدات من CEC كمقياس للطلب العام على طلبات المحولات في جميع أنحاء العالم.
مزيج التوليد: الرياح والطاقة الشمسية تحقق النمو
تخبرك القدرة المثبتة بما تبنيه الصين؛ بينما تخبرك التوليد بما يقدمه النظام فعليًا. كان إجمالي التوليد في عام 2023 هو 9,456 تيروات ساعة، بزيادة قدرها 6.9%، وشكل تلك الزيادة هو قصة الانتقال الطاقي في جدول واحد.
| نوع التوليد | الإنتاج 2023 (تيروات ساعة) | على أساس سنوي | حصة من الإجمالي |
|---|---|---|---|
| الإجمالي | 9,456 | +6.9% | 100% |
| حراري | 6,266 | +6.4% | 66.3% |
| الطاقة الكهرومائية | 1,286 | -4.9% | 13.6% |
| رياح | 886 | +16.2% | 9.4% |
| شمسية | 584 | +36.7% | 6.2% |
| نووي | 435 | +4.1% | 4.6% |
زاد الجمع بين طاقة الرياح والطاقة الشمسية من إجمالي إنتاج الطاقة بمقدار 280 تيروات ساعة، وهو ما يمثل 46.1% من إجمالي الزيادة في توليد الطاقة. ومع ذلك، لا يزال الحراري يمثل 66% من إجمالي إنتاج الطاقة في البلاد حيث يستمر الفحم في كونه مصدر طاقة موثوق ومتوافر. توفر هذه الحالة الفريدة من النمو في الطاقة المتجددة مع الاعتماد على الفحم تفسيرًا لماذا تستخدم الصين كل من المحولات الحديثة التي تعمل على مصادر الطاقة المتجددة والمرافق الحرارية التقليدية في نفس الوقت.
حصة غير الأحفوري تتجاوز 50%: تحول هيكلي
للمرة الأولى في عام 2023، شكلت الوقود غير الأحفوري أكثر من 50% من إجمالي القدرة المثبتة في الصين عند 53.9%. تعتقد CEC أن هذا مرتبط بهدف ذروة انبعاث الكربون قبل عام 2030 وتحقيق الحياد الكربوني بحلول عام 2060. من حيث الطلب على القدرة، التفسير واضح: يعني نمو بنسبة واحد في المئة من الطاقة من مصادر غير أحفورية مزيدًا من قدرة الربط الشبكي، ومزيدًا من تعويض الطاقة التفاعلية، ومزيدًا من تخزين الطاقة مقارنةً بالنمو المعادل للطاقة التقليدية.
تساعد نقطتان إضافيتان في فهم أفضل للوضع. أولاً، انخفضت حصة الفحم من إجمالي القدرة المركبة إلى 39.9%. ثانياً، في عام 2023، تم استخدام محطات الطاقة الشمسية لمدة 1286 ساعة فقط، مما يشير إلى زيادة ضغوط التقييد في بعض مناطق الصين. بالنظر إلى الحقائق المذكورة أعلاه، قررت CEC التركيز على الاستثمارات في وصلات الشبكة لخطوط التوزيع بينما تم تخصيص حوالي 55% من النفقات على شبكات الطاقة في مجال الشبكات التي تبلغ 110 كيلو فولت وما دون.
توقعات 2024: 3.25 تيروات بحلول نهاية العام
توقع التقرير المنشور في يناير 2024 أن تحقق الصين أكثر من 3,250 جيجاوات من حيث القدرة الاستيعابية للطاقة المركبة بحلول نهاية 2024، مما يمثل زيادة قدرها 12%، بينما سيتم تشغيل أكثر من 300 جيجاوات من المشاريع الجديدة - أكثر من 200 جيجاوات منها ستكون من الموارد المتجددة. تُظهر التوقعات أن حصة الطاقة غير الأحفورية في مزيج الطاقة من المتوقع أن تصل إلى حوالي 57%، بينما ستصل طاقة الرياح إلى 530 جيجاوات، في حين ستصل الطاقة الشمسية إلى علامة 780 جيجاوات، عندما سيتمكن كلا المصدرين من تجاوز إجمالي قدرة طاقات الفحم.
| مقياس | 2023 الفعلي | 2024 التوقعات (CEC) |
|---|---|---|
| إجمالي السعة المثبتة | 2,922 جيجاوات | ~3,250 جيجاوات |
| حصة غير الأحفوري | 53.9% | ~57% |
| طاقة الرياح المركبة | 441 جيجاوات | ~530 جيجاوات |
| الطاقة الشمسية المركبة | 610 جيجاوات | ~780 جيجاوات |
| استهلاك الكهرباء | 22 تريليون كيلووات ساعة | ~9.8 تريليون كيلوواط ساعة (+6%) |
| الحمل الأقصى | 345 مليار كيلوواط | ~1.45 مليار كيلوواط |
البيانات المهمة لمشتري المعدات هي استهلاك الطاقة، الذي بلغ حوالي 9.8 تريليون كيلوواط ساعة، بزيادة قدرها 6%. وقد تم ربط هذا النمو بصناعات التصنيع عالية التقنية، ومرافق شحن السيارات الكهربائية (التي نمت بنسبة 78.1% على أساس سنوي)، ومصانع الطاقة الشمسية أو بطاريات التصنيع. لذلك، إذا ارتفع استهلاك الطاقة بنسبة 6%، فإن النمو في قدرة التوزيع يجب ألا يقل عن ذلك، ويجب أن تتضمن قائمة الطلبات للمحولات هذا النمو في القدرة.
استثمار الشبكة ومحرك طلب المحولات
تتفق كلا التقريرين على تسريع استثمارات الشبكة. في عام 2023، استثمرت الشركات الكبرى في الطاقة مجتمعة 1,550.2 مليار يوان، بزيادة قدرها 24.7%. كانت استثمارات توليد الطاقة 1,022.5 مليار يوان، بينما كانت استثمارات بناء الشبكة 527.7 مليار يوان، بزيادة قدرها 5.4%. تبعت البنية التحتية للنقل الاتجاهات: 919,667 كم من الخطوط بجهد 220 كيلو فولت وما فوق و5,424 جيجا فولت أمبير من قدرة المحولات بجهد 220 كيلو فولت وما فوق، حيث زادت الأخيرة بنسبة 5.7%.
| مقياس الشبكة (نهاية 2023) | القيمة | على أساس سنوي |
|---|---|---|
| خطوط النقل بجهد 220 كيلو فولت وما فوق | 919,667 كم | +4.6% |
| قدرة المحولات بجهد 220 كيلو فولت وما فوق | 5,424 جيجا فولت أمبير | +5.7% |
| نقل الطاقة عبر المناطق | 7 تيراوات ساعة | +9.7% |
| استثمار بناء الشبكة | 7 مليار يوان | +5.4% |
| حصة الإنفاق على الشبكة عند 110 كيلو فولت وما دون | 55% | – |
تعني الزيادة البالغة 5.7% في قدرة المحولات بجهد 220 كيلو فولت وما فوق إشارة واضحة لمشتري المحولات الثقيلة. تشير 55% من الوزن لصالح 110 كيلو فولت وما دون إلى الطلب على محولات التوزيع. الاستثمارات في قطاع التوزيع في أعمال المرافق في الصين مرتفعة لدمج الطاقة الشمسية الموزعة وأحمال شحن السيارات الكهربائية، ولا يزال هناك قدرة تصنيع متاحة في هذا القطاع.
ماذا تعني هذه الأرقام لمشتري المحولات
توصلت التقارير التي تم تحليلها من وجهة نظر الشراء إلى خمس استنتاجات رئيسية:
استمرار الطلب العالي حتى عام 2025. يُقدّر أن الطلب في عام 2024 سيتجاوز 300 جيجاوات من القدرة المركبة، مما يعني أخبارًا جيدة للإنتاج المستمر لمحولات الرفع، ومعدات الجهد المتوسط (MV) والجهد المنخفض (LV)، ومعدات دمج تقنيات تخزين الطاقة.
تفوز المحولات التوزيعية في منافسة الحجم. مع أكثر من 55% من الاستثمارات المستهدفة للشبكات التي تم بناؤها بالفعل بمستويات جهد أقل من 110 كيلوفولت، من غير المرجح أن تشهد المحولات التوزيعية، التي تتكون أساسًا من وحدات بقوة تتراوح من 100 كVA إلى 2,500 كVA، في كل من النسخ المغمورة بالزيت والجافة، انخفاضًا في الطلب على الأقل حتى عام 2025.
تؤثر قيود السعة على المحولات الكبيرة. مع قاعدة مثبتة تبلغ 5,424 GVA والنمو السنوي المتوقع بنسبة 5.7%، فإن المحولات عالية الجهد لديها فترات إنتاج ضيقة.
تتطلب تخزين الطاقة مواصفات جديدة. مع دمج البطاريات في الأنظمة، يتطلب تدفق الطاقة ثنائي الاتجاه محولات بمواصفات كفاءة جديدة وخصائص تحميل أفضل.
تتميز الأسعار بالضغط الهيكلي بدلاً من الضغط الدوري. جنبًا إلى جنب مع أسعار النحاس وتكاليف أنواع الصلب الخاصة، تمنع دفاتر الطلبات الضيقة الأسعار من الانخفاض دون بعض المستويات.
من أجل وضع ميزانية بشكل واقعي، يجب أخذ أسعار FOB الحالية من الصين في الاعتبار والتي تتراوح من $2,500 إلى $5,000 لمحولات التوزيع المغمورة بالزيت بقوة 100 كVA، ومن $8,000 إلى $15,000 لوحدة بقوة 315 كVA، ومن $15,000 إلى $30,000 لمحولات بقوة 1,000 كVA. يتم تسعير المحولات الجافة بزيادة تتراوح بين 20-35% عن الوحدات المغمورة بالزيت، بينما تتراوح أوقات الإنتاج المتوقعة من 8 إلى 16 أسبوعًا لمحولات قياسية ومن 20 إلى 40 أسبوعًا لمحولات الطاقة التي تتجاوز جهدها 110 كيلوفولت، اعتمادًا على تحميل المصنع.
التأثير العالمي: الأسعار، أوقات التسليم، وتخزين الطاقة
تمثل إنتاج الصين من المحولات حوالي ثلثي جميع المحولات المنتجة، مما يضمن أن البناء المحلي سيكون له تأثير كبير على السوق العالمية. أفاد السوق أن الوضع يتزامن مع البيانات المنشورة من CEC بما في ذلك ارتفاع الأسعار للصلب السيليكوني الموجه، وخطوط الإنتاج بكامل طاقتها، والمواعيد النهائية الضيقة للأجهزة الكبيرة.
فيما يتعلق بالتأثير الثاني على نظام تخزين الكهرباء في اتصال مع النمو القياسي للطاقة الشمسية في الصين، تشير العلامات إلى أنه من الضروري وجود نظام يستخدم الطاقة الإضافية في منتصف النهار. بدوره، تحتوي جميع أنظمة تخزين الطاقة بالبطاريات على محول واجهة LV وMV فردي يجب أن يلبي المتطلبات الخاصة المتعلقة بالعمليات ثنائية الاتجاه.
الشركات المصنعة التي تزود البناء
تنقسم الشركات التجارية التي تستفيد من الطلب إلى مستويات أهمية معتادة. الشركات المعروفة عالميًا مثل Hitachi Energy وSiemens وABB تشارك في تصنيع المحولات عالية الجودة مع مؤهلات عالية من الاختبارات والخبرة في مشاريعها الهندسية. في الوقت نفسه، تعمل Schneider Electric في مجال المحولات منخفضة الجهد والشبكات الرقمية. يتم تصنيع معظم المنتجات في الصين، مثل TBEA وBaoding Tianwei وChina XD Group، التي يتم توجيه إنتاجها إلى السوق المحلية والصادرات وتعتمد على معدلات إنتاجية عالية.
| الشركة المصنعة | نقاط القوة | مجموعة المنتجات النموذجية |
|---|---|---|
| هيتاشي للطاقة | محولات الطاقة عالية الجهد، HVDC، المحولات الفاخرة | 40-500 MVA، حتى فئة 800 kV |
| سيمنز | شبكة خدمات عالمية، محولات رقمية | توزيع إلى فئة 500 MVA |
| ABB | مجموعة واسعة من LV/MV، تكامل الأتمتة | توزيع، مثبتة على القاعدة، نوع جاف |
| شنايدر إلكتريك | معدات التبديل LV، منصة EcoStruxure الرقمية | محولات التوزيع، تجميعات LV |
| TBEA | المحولات الكهربائية الكبيرة، حجم الصادرات | حتى فئة 1,000 كيلوفولت |
| شركة جيانغسو سوبين للطاقة الكهربائية | معتمدة وفقًا لمعيار IEC 60076، أسعار تنافسية، أوقات تسليم مرنة | 50 كVA-40 MVA، مغمورة بالزيت ونوع جاف |
يتم ملء الفجوة من قبل المنتجين الصينيين من المستوى المتوسط لأولئك المستوردين الذين يحتاجون إلى وحدات معتمدة وفقًا لمعيار IEC 60076 والوثائق الاختبارية المرتبطة بها ولكن لا يمكنهم تحمل الأسعار المرتفعة التي يفرضها اللاعبون العالميون الرائدون. شركة جيانغسو سوبين للطاقة الكهربائية هي مثال على مثل هذا المنتج المسجل في مقاطعة جيانغسو، تصدر المحولات إلى آسيا وأفريقيا والشرق الأوسط وأمريكا اللاتينية. تزود الشركة المحولات المتوسطة والتوزيع بمواصفات واضحة للمكونات في إطار زمني يتراوح بين 8-16 أسبوعًا.
الأسئلة المتكررة
ما هي سعة الصين المركبة وتوليد الطاقة في عام 2023؟
أنهت الصين عام 2023 بسعة مركبة تبلغ 2,922 جيجاوات، بزيادة قدرها 14.0%، وولدت 9,456 تيراوات ساعة من الكهرباء، بزيادة قدرها 6.9%. وصلت السعة غير الأحفورية إلى 53.9% من الإجمالي لأول مرة، وبلغت سعة الرياح والطاقة الشمسية مجتمعة 1,050 جيجاوات. كان استهلاك الكهرباء 9.22 تريليون كيلوواط ساعة، بزيادة قدرها 6.7%.
ما مدى سرعة إضافة الصين لسعة الطاقة الشمسية والرياح؟
أضافت الطاقة الشمسية رقمًا قياسيًا بلغ 217 جيجاوات في عام 2023، بزيادة قدرها 55.5% إلى 610 جيجاوات، بينما نمت طاقة الرياح بمقدار 20.7% إلى 441 جيجاوات. تتوقع CEC إضافة أكثر من 200 جيجاوات من سعة الطاقة الجديدة في عام 2024، مما يرفع سعة الرياح إلى حوالي 530 جيجاوات والطاقة الشمسية إلى حوالي 780 جيجاوات بحلول نهاية العام، حيث تتجاوز سعة الرياح والطاقة الشمسية الفحم من حيث السعة المركبة.
ماذا تعني هذه التقارير لأسعار المحولات وأوقات التسليم؟
يحافظ البناء المستمر على ضيق سعة التصنيع. خصص ميزانية تتراوح بين $2,500-$5,000 لمحولات توزيع بقدرة 100 كVA و$15,000-$30,000 لـ 1,000 كVA FOB الصين، مع أوقات تسليم تتراوح بين 8-16 أسبوعًا للوحدات القياسية. تعمل محولات الطاقة من فئة 110 كيلوفولت لفترات أطول، عادةً 20-40 أسبوعًا، بسبب ازدحام فترات الإنتاج عالية الجهد.
لماذا تعتبر استثمارات الشبكة مهمة لمشاريع تخزين الطاقة؟
أنفقت مشغلات الشبكة في الصين 527.7 مليار يوان في عام 2023، مع تخصيص 55% لشبكة التوزيع بجهد 110 كيلوفولت وما دون، جزئيًا لدمج الطاقة الشمسية الموزعة، وشحن السيارات الكهربائية (بزيادة قدرها 78.1%)، وتخزين البطاريات. تحتاج مشاريع التخزين إلى محولات مصنفة لتدفق ثنائي الاتجاه، ونطاقات سحب أوسع، وتحمل التوافقيات، وهي من بين أسرع فئات الشراء نموًا.
هل لا تزال الصين توسع من طاقة الفحم؟
نعم، ولكن ببطء. وصلت سعة الفحم إلى 1,165 جيجاوات في عام 2023، بزيادة قدرها 3.4% فقط، وانخفضت حصتها إلى أقل من 40% لأول مرة. لا يزال الفحم ينتج ما يقرب من 60% من التوليد في عام 2023، لذا فإنه يبقى العمود الفقري للموثوقية بينما تنمو السعة غير الأحفورية، ولكن كل عام متتالي يحول التوازن أكثر نحو الطاقة المتجددة.
المراجع
- مجلس الكهرباء الصيني (CEC) – ناشر تقرير التنمية السنوية لصناعة الطاقة الكهربائية في الصين 2024 وتوقعات العرض والطلب 2023-2024، مصدر جميع إحصائيات السعة والتوليد المذكورة أعلاه.
- الإدارة الوطنية للطاقة (NEA) – الهيئة التنظيمية للطاقة في الصين، تنشر الإحصائيات الشهرية والسنوية الأساسية حول السعة المركبة والتوليد.
- وكالة الطاقة الدولية الكهرباء 2024 – تحليل مستقل وتوقعات للطلب العالمي على الكهرباء، والطاقة المتجددة، واستثمارات الشبكة، مفيد للتحقق من بيانات CEC.
- IEA: ملف تعريف دولة الصين – السياق الدولي حول انتقال الطاقة في الصين وحصتها من تصنيع معدات الطاقة العالمية.
- IEC 60076-1: المحولات الكهربائية – عام – المعيار الدولي الذي يتم اختبار المحولات الموردة للأسواق الصينية وأسواق التصدير وفقًا له.
- مراجعة إحصائية لمعهد الطاقة للطاقة العالمية – بيانات الطاقة العالمية بما في ذلك مزيج توليد الطاقة في الصين، للمقارنة بين الأسواق.
- شركة جيانغسو سوبين للطاقة الكهربائية – شركة صينية مصنعة للمحولات معتمدة وفقًا لمعيار IEC 60076، تزود المحولات الكهربائية ومحولات التوزيع للمشترين الدوليين.
الخاتمة
تقدم كلا تقريري CEC حسابًا يت reconciles جميع التغييرات التي تحدث في المجالات الاقتصادية والصناعية في الصين. وفقًا لهذه التقارير، أضافت الصين 2,922 ميغاوات حتى نهاية 2023، ومن المتوقع أن يصل العدد إلى 3,250 ميغاوات بحلول نهاية 2024، بينما تجاوزت حصة المصادر المتجددة للمرة الأولى 50% من الهيكل الكامل لتوليد الطاقة. تعتبر طاقة الرياح والطاقة الشمسية والنظام المسؤول عن ربطها القوة الدافعة وراء المحولات، ومعدات الطاقة، وآلات تخزين الكهرباء التي تخلق بنية تحتية لتوريد الطاقة، وبالتالي، تؤدي إلى الطلب على المشتريات من جميع الدول التي تبحث عن المحولات ومفاتيح محطات الطاقة.
أما بالنسبة للتوصيات الفعالة للعملاء، فيمكن أن تكون بسيطة. من الضروري تحديد تكاليف المحولات التي يكون المنتجون مستعدين لبيعها في الصين، والتي تتراوح من 1,000 إلى 2,500 لــ 100 كيلوفولت أمبير إلى 15,000 وما فوق لــ 1,000 كيلوفولت أمبير. علاوة على ذلك، يجب على الشركة فرض قيود على الموردين الذين لديهم مستندات اعتماد على منتجاتهم وجدول تسليمها. تعتبر شركة جيانغسو سوبين للطاقة الكهربائية واحدة من موردي المحولات المعتمدة وفقًا لمعيار IEC 60076 مع ضمانات توفر الشفافية في مواصفات آلاتها.